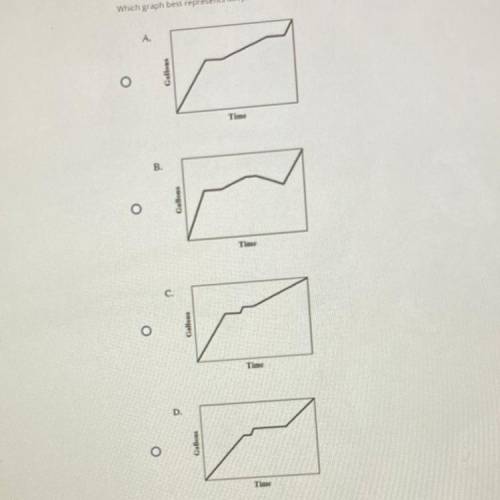
Mr jones began filling the pool at a constant rate
he turned off the water for a while
he th...

Mathematics, 12.03.2021 07:00 pikachu20040
Mr jones began filling the pool at a constant rate
he turned off the water for a while
he then turned the water back on at a slower constant rate
mr. jones turned the water off again for a while
he then turned the water back on at the first rate
which graph best represents mr. jones filling the pool

Answers: 1


Other questions on the subject: Mathematics
Mathematics, 21.06.2019 17:00, tamaliablanchard
This is different from the first one can someone me
Answers: 1
Mathematics, 22.06.2019 00:00, crazylogic963
Charlie is at an amusement park that has 18 different rides. each ride costs $1.75. the function c(r) = 1.75r represents the total amount of money that charlie will spend if he goes on r rides, but he never goes on the same one more than once. what domain and range are reasonable for the function?
Answers: 3
Mathematics, 22.06.2019 03:00, Alizerodriguez2010
Rectangle abcd is similar to rectangle rstu . what is the scale factor of a dilation from abcd to rstu ? enter your answer in the box.
Answers: 2
Mathematics, 22.06.2019 04:30, xxtonixwilsonxx
Solve the following system algebraically. y = x2 – 9x + 18 y = x – 3 a. (3,1) and (5,3) b. (3,0) and ( 4,2) c. (–4,5) and (7,–10) d. (7,4) and (3,0)
Answers: 3
You know the right answer?
Questions in other subjects:


English, 25.03.2021 20:50
Mathematics, 25.03.2021 20:50

History, 25.03.2021 20:50
English, 25.03.2021 20:50


