The graph shows the value of an investment after x years
(The coordinates are)
0,500
1,...

Mathematics, 11.03.2021 23:40 destinybonmer
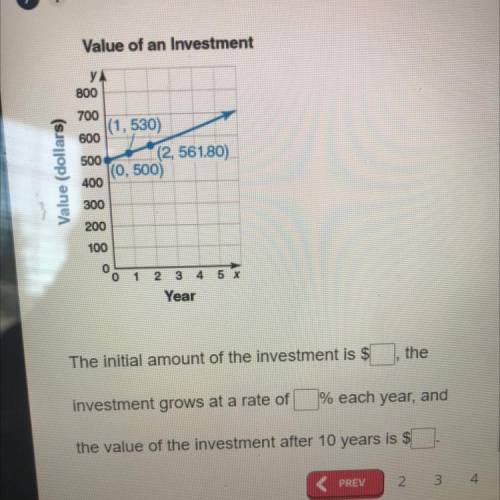
The graph shows the value of an investment after x years
(The coordinates are)
0,500
1,530
2,561.80
What is the initial amount
What rate does the initial amount grow at
And what is the value after 10 years?

Answers: 1


Other questions on the subject: Mathematics
Mathematics, 21.06.2019 17:10, payshencec21
The number of chocolate chips in an 18-ounce bag of chocolate chip cookies is approximately normally distributed with a mean of 1252 chips and standard deviation 129 chips. (a) what is the probability that a randomly selected bag contains between 1100 and 1500 chocolate chips, inclusive? (b) what is the probability that a randomly selected bag contains fewer than 1125 chocolate chips? (c) what proportion of bags contains more than 1225 chocolate chips? (d) what is the percentile rank of a bag that contains 1425 chocolate chips?
Answers: 1
Mathematics, 21.06.2019 17:30, kruzyoungblood8
When a rectangle is dilated, how do the perimeter and area of the rectangle change?
Answers: 2
Mathematics, 21.06.2019 19:30, joselinegarciaowyrpf
Asquare picture with sides of 32 inches is to be mounted on a square mat with sides of 52 inches. find the area of the mat that will remain uncovered by the picture.
Answers: 1
You know the right answer?
Questions in other subjects:


Mathematics, 25.03.2021 18:00
Mathematics, 25.03.2021 18:00
Mathematics, 25.03.2021 18:00
Chemistry, 25.03.2021 18:00


