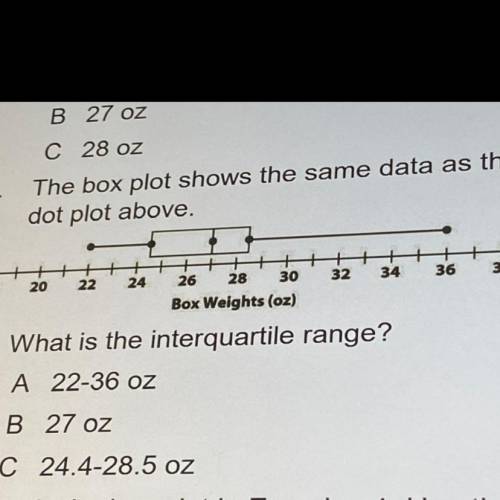
The box plot shows the same data as the
dot plot above.
...

Mathematics, 11.03.2021 20:00 OinkFred
The box plot shows the same data as the
dot plot above.

Answers: 2


Other questions on the subject: Mathematics
Mathematics, 21.06.2019 19:00, alyo31500
Graph g(x)=2cosx . use 3.14 for π . use the sine tool to graph the function. graph the function by plotting two points. the first point must be on the midline and closest to the origin. the second point must be a maximum or minimum value on the graph closest to the first point.
Answers: 1
Mathematics, 21.06.2019 19:00, 592400014353
The test scores of 32 students are listed below. construct a boxplot for the data set and include the values of the 5-number summary. 32 37 41 44 46 48 53 55 57 57 59 63 65 66 68 69 70 71 74 74 75 77 78 79 81 82 83 86 89 92 95 99
Answers: 1
Mathematics, 21.06.2019 21:20, pampam49
An office supply company conducted a survey before marketing a new paper shredder designed for home use. in the survey, 80 % of the people who tried the shredder were satisfied with it. because of this high satisfaction rate, the company decided to market the new shredder. assume that 80 % of all people are satisfied with this shredder. during a certain month, 100 customers bought this shredder. find the probability that of these 100 customers, the number who are satisfied is 69 or fewer.
Answers: 2
You know the right answer?
Questions in other subjects:

Biology, 02.08.2019 07:30
Biology, 02.08.2019 07:30
Biology, 02.08.2019 07:30


