
Mathematics, 11.03.2021 18:20 valeriegarcia12
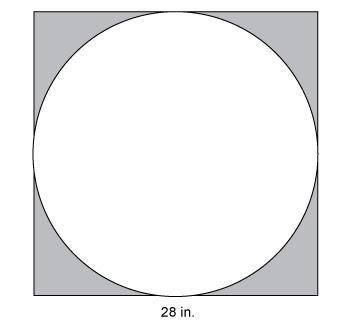
A circle is drawn within a square as shown.
What is the best approximation for the area of the shaded region?
Use 3.14 to approximate pi.
A. 168.56 in²
B. 696.08 in²
C. 740.04 in²
D. 1677.76 in²
I added a picture for it this time

Answers: 1


Other questions on the subject: Mathematics
Mathematics, 21.06.2019 18:00, evarod
The given dot plot represents the average daily temperatures, in degrees fahrenheit, recorded in a town during the first 15 days of september. if the dot plot is converted to a box plot, the first quartile would be drawn at __ , and the third quartile would be drawn at link to the chart is here
Answers: 1
Mathematics, 22.06.2019 03:30, kevenluna10oytivm
At the beginning of a call to the cable company, a message tells customers, "after you finish talking to our customer service representative, you will be asked to take a five-question survey about the level of service you recieved. it would be appreciated if you could stay on the line to answer the survey questions." what type of sampling is the cable company using?
Answers: 3
You know the right answer?
A circle is drawn within a square as shown.
What is the best approximation for the area of the shad...
Questions in other subjects:


Mathematics, 06.05.2020 05:33


