subject
Mathematics, 11.03.2021 18:10 xdoran

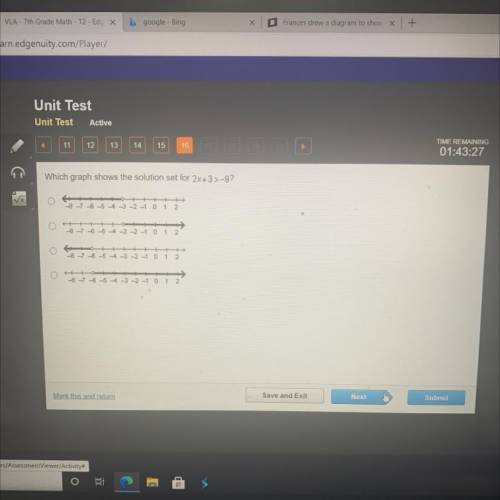
Which graph shows the solution set for 2x+3 >-9? o
8 -7 -6 -5 -4 -3 -2 -1 0
1 2
o
-6-5-4 - -21
0
1
2
0
-8 -7 -6 -5 -4 -3 -2 -1
0
1
2
O +
-8 -7 -6 -5 4 3 2-1
1
2
Save and Exit
Next
Submit
Mark this and return


Which graph shows the solution set for 2x+3 >-9?

o
8 -7 -6 -5 -4 -3 -2 -1 0
1 2
o
-6-5-4 - -21

ansver
Answers: 3

Other questions on the subject: Mathematics

image
Mathematics, 21.06.2019 15:30, brittanysanders
Look at the following graph of the given equation. determine whether the equation is a function. explain why or why not.
Answers: 1
image
Mathematics, 21.06.2019 19:30, marvin07
Anna is constructing a line segment that is congruent to another segment ab. for the construction, which tool should be used to mesure segment ab
Answers: 1
image
Mathematics, 21.06.2019 19:30, MariaIZweird7578
Combine the information in the problem and the chart using the average balance method to solve the problem.
Answers: 2
image
Mathematics, 22.06.2019 02:00, princess6039
The poll report includes a table titled, “americans using cash now versus five years ago, by age.” the age intervals are not equal. why do you think the gallup organization chose the age intervals of 23–34, 35–54, and 55+ to display these results?
Answers: 3