How would the graph look for the inequality below?
225 < a + 197
A
B
open and...

Mathematics, 11.03.2021 18:00 taegibbby03
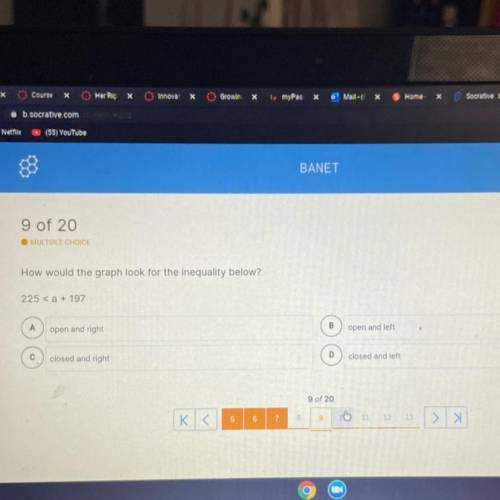
How would the graph look for the inequality below?
225 < a + 197
A
B
open and right
open and left
с
closed and right
D
closed and left

Answers: 3


Other questions on the subject: Mathematics
Mathematics, 21.06.2019 18:20, rishiganesh
The length of a rectangle plus its width is 25 cm. the area is 156 square cm. what are the length and width of the rectangle? separate the answers with a comma.
Answers: 3
Mathematics, 21.06.2019 22:00, goodperson21
White shapes and black shapes are used in a game. some of the shapes are circles. while the rest are squares. the ratio of the number of white shapes to the number of black shapes is 5: 11. the ratio of the number of white cicrles to the number of white squares is 3: 7. the ratio of the number of black circles to the number of black squres is 3: 8. work out what fraction of all the shapes are circles.
Answers: 2
Mathematics, 21.06.2019 23:50, jasminechambers642
What is the probably of getting heads when poing a coin and getting a number greater than or equal to 5 when rolling a single diea) 1/6b) 1/3c) 1/4d) 1/12
Answers: 2
You know the right answer?
Questions in other subjects:


Chemistry, 28.06.2019 00:00
Mathematics, 28.06.2019 00:00
English, 28.06.2019 00:00


Geography, 28.06.2019 00:00


