
Mathematics, 11.03.2021 16:50 jfedele7900
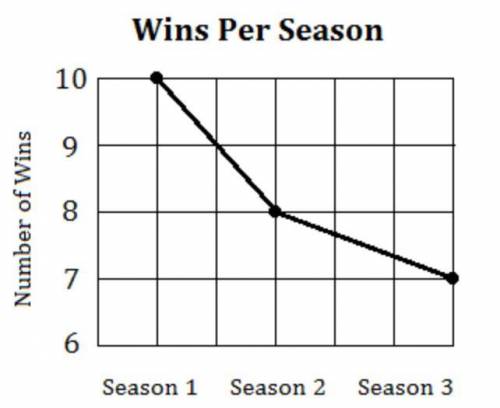
The following graph shows the number of soccer games a team won in each of their first three seasons. Explain how you could redraw the graph so that the change in wins between the three seasons does not seem so great.

Answers: 2


Other questions on the subject: Mathematics
Mathematics, 21.06.2019 19:00, mcccreamullinsr
How can you tell when x and y are not directly proportional?
Answers: 1
Mathematics, 21.06.2019 19:10, dylancasebere
What is the quotient of m^6/5 ÷ 5/m^2? assume m does not equal pl
Answers: 1
Mathematics, 21.06.2019 20:00, brevenb375
What effect would doubling all the dimensions of a triangular pyramid have on the volume of the pyramid? explain your reasoning.
Answers: 1
Mathematics, 21.06.2019 22:10, eddiewoods8505
Which property was used to simplify the expression? 3c+9 +4c=3c+4c+9
Answers: 3
You know the right answer?
The following graph shows the number of soccer games a team won in each of their first three seasons...
Questions in other subjects:

English, 05.07.2019 13:30

Mathematics, 05.07.2019 13:30

Social Studies, 05.07.2019 13:30


