
Mathematics, 11.03.2021 03:20 lilfofo9
Nora tracked variations in temperature for five days to show how much above or below average the actual temperature was.
A 5-column table with 1 row titled Degrees Above/Below Average (Fahrenheit). Column 1 is labeled Monday with entry 2.2. Column 2 is labeled Tuesday with entry negative one-half. Column 3 is labeled Wednesday with entry negative 1 and one-half. Column 4 is labeled Thursday with entry negative 0.9. Column 5 is labeled Friday with entry 1. A number line going from negative 3 to positive 3.
Graph the data on the number line.
On which day was the temperature the farthest below average?

Answers: 3


Other questions on the subject: Mathematics
Mathematics, 21.06.2019 19:30, iloading5117
Carlos spent 1 1/4 hours doing his math homework he spent 1/4 of his time practicing his multiplication facts how many hours to carlos been practicing his multiplication facts
Answers: 2
Mathematics, 21.06.2019 22:00, huangjianhe135
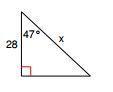
`if you have a set of parallel lines a and b cut by transversal x, if angle 1 = 167 degrees, what is angle 4 and why. also what is the measure of angle 5 and why? you need to use the names of the angle relationship and explain. ''.
Answers: 3
Mathematics, 21.06.2019 23:10, izzynikkie
Which graph represents the linear function below? y-4= (4/3)(x-2)
Answers: 2
You know the right answer?
Nora tracked variations in temperature for five days to show how much above or below average the act...
Questions in other subjects:
Mathematics, 01.12.2020 02:30


Biology, 01.12.2020 02:30
Mathematics, 01.12.2020 02:30

Social Studies, 01.12.2020 02:30
Mathematics, 01.12.2020 02:30

Physics, 01.12.2020 02:30

English, 01.12.2020 02:30


