
Mathematics, 10.03.2021 22:40 bombbomb2157
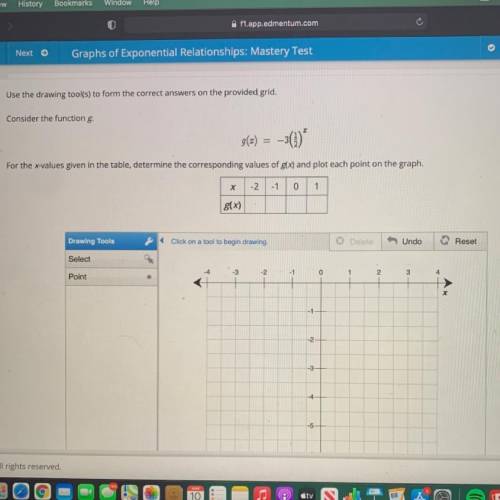
Use the drawing tool(s) to form the correct answers on the provided grid.
Consider the function g.
For the x-values given in the table, determine the corresponding values of g(x) and plot each point on the graph.
Х
-2
0
1
g(x)

Answers: 2


Other questions on the subject: Mathematics
Mathematics, 21.06.2019 21:30, neptunesx
Students are given 3 minutes to complete each multiple-choice question on a test and 8 minutes for each free-responsequestion. there are 15 questions on the test and the students have been given 55 minutes to complete itwhich value could replace x in the table? 5507-m23-m8(15-m)8(15)-m
Answers: 2
Mathematics, 22.06.2019 01:20, GreenHerbz206
Given: δabc, m∠1=m∠2, d∈ ac bd = dc m∠bdc = 100º find: m∠a m∠b, m∠c
Answers: 2
You know the right answer?
Use the drawing tool(s) to form the correct answers on the provided grid.
Consider the function g.<...
Questions in other subjects:


Computers and Technology, 23.08.2019 00:10

Computers and Technology, 23.08.2019 00:10


