
Mathematics, 10.03.2021 22:40 kbenitez90
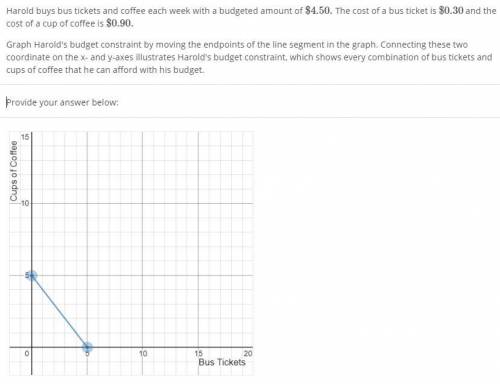
Harold buys bus tickets and coffee each week with a budgeted amount of $4.50. The cost of a bus ticket is $0.30 and the cost of a cup of coffee is $0.90.
Graph Harold's budget constraint by moving the endpoints of the line segment in the graph. Connecting these two coordinate on the x- and y-axes illustrates Harold's budget constraint, which shows every combination of bus tickets and cups of coffee that he can afford with his budget.
Provide your answer below:

Answers: 1


Other questions on the subject: Mathematics
Mathematics, 21.06.2019 22:10, BilliePaul95
Ellen makes and sells bookmarks. she graphs the number of bookmarks sold compared to the total money earned. why is the rate of change for the function graphed to the left?
Answers: 1
Mathematics, 21.06.2019 22:20, jhonnysoriano9053
Select the correct answer from each drop-down menu. the table shows the annual sales revenue for different types of automobiles from three automobile manufacturers. sales revenue (millions of dollars) suv sedan truck marginal total b & b motors 22 15 9 46 pluto cars 25 27 10 62 panther motors 26 34 12 72 marginal total 73 76 31 180 the company with the highest percentage of sales revenue from sedans is . of the annual sales revenue from suvs, the relative frequency of pluto cars is .
Answers: 1
Mathematics, 21.06.2019 23:40, guadalupemarlene2001
Which set of side lengths form a right side? a) 3ft,6ft,5ft b)50 in,48in,14in c)53m,48m,24m d)8cm,17cm,14cm
Answers: 2
You know the right answer?
Harold buys bus tickets and coffee each week with a budgeted amount of $4.50. The cost of a bus tick...
Questions in other subjects:
Mathematics, 25.07.2019 16:40

English, 25.07.2019 16:40

Mathematics, 25.07.2019 16:40
Mathematics, 25.07.2019 16:40
History, 25.07.2019 16:40
History, 25.07.2019 16:40


