Mathematics, 10.03.2021 22:00 jessie9772
HELP
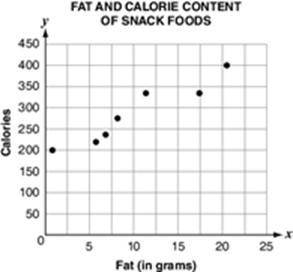
The scatter plot shown below displays the fat, x, and calorie content, y, of several snack foods.
The equation y = 10x + 190 represents the relationship of the given data. What does the 10 in the function represent?


Answers: 1


Other questions on the subject: Mathematics

Mathematics, 20.06.2019 18:02, daedae11142
Twelve friends shared 8 small pizzas equally. how many pizzas did each person get?
Answers: 2


Mathematics, 21.06.2019 22:00, amandajennings01
22. catie is starting a babysitting business. she spent $26 to make signs to advertise. she charges an initial fee of $5 and then $3 for each hour of service. write and solve an inequality to find the number of hours she will have to babysit to make a profit. interpret the solution.!
Answers: 1
You know the right answer?
HELP
The scatter plot shown below displays the fat, x, and calorie content, y, of several snack foo...
Questions in other subjects:


Social Studies, 18.01.2021 04:00


Mathematics, 18.01.2021 04:00

Computers and Technology, 18.01.2021 04:00

Advanced Placement (AP), 18.01.2021 04:00

Mathematics, 18.01.2021 04:00

Mathematics, 18.01.2021 04:00


