
Mathematics, 10.03.2021 17:10 lil8174
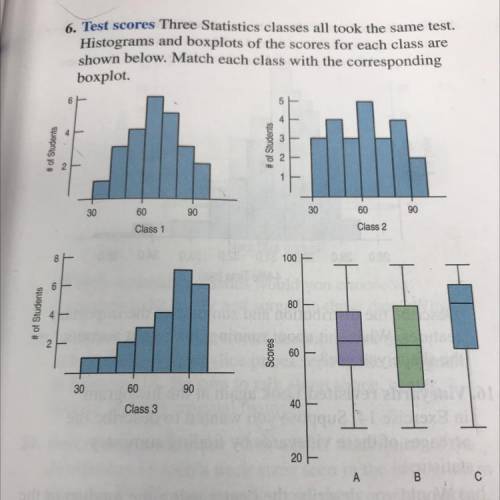
Three Statistics classes all took the same test.
Histograms and boxplots of the scores for each class are
shown below. Match each class with the corresponding
boxplot.

Answers: 3


Other questions on the subject: Mathematics
Mathematics, 21.06.2019 14:30, purpletart41
Arrange these numbers from least to greatest 3/5 5/7 2/9
Answers: 2
Mathematics, 21.06.2019 17:00, vandarughb2875
The perimeter of a stage is 116 feet. it is 17 feet wide. how long is it?
Answers: 1
Mathematics, 21.06.2019 20:50, brea2006
An automobile assembly line operation has a scheduled mean completion time, μ, of 12 minutes. the standard deviation of completion times is 1.6 minutes. it is claimed that, under new management, the mean completion time has decreased. to test this claim, a random sample of 33 completion times under new management was taken. the sample had a mean of 11.2 minutes. assume that the population is normally distributed. can we support, at the 0.05 level of significance, the claim that the mean completion time has decreased under new management? assume that the standard deviation of completion times has not changed.
Answers: 3
You know the right answer?
Three Statistics classes all took the same test.
Histograms and boxplots of the scores for each cla...
Questions in other subjects:
Mathematics, 27.02.2020 02:53


Mathematics, 27.02.2020 02:53


