Question 1 of 9
Assume you have collected data pairs (x, y) on a certain variety of tree. xis
...

Mathematics, 10.03.2021 07:50 orlando19882000
Question 1 of 9
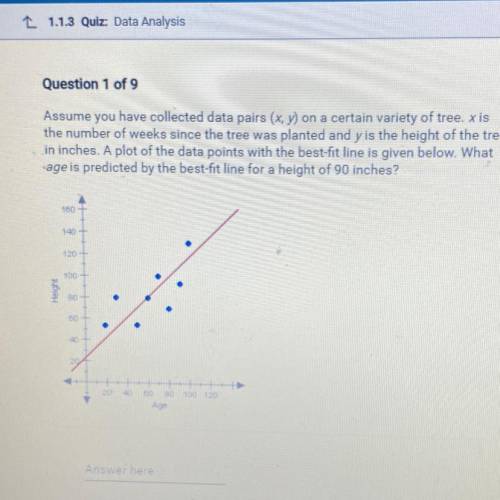
Assume you have collected data pairs (x, y) on a certain variety of tree. xis
the number of weeks since the tree was planted and y is the height of the tree
in inches. A plot of the data points with the best-fit line is given below. What
age is predicted by the best-fit line for a height of 90 inches?
150
140
120
500
.

Answers: 3


Other questions on the subject: Mathematics
Mathematics, 21.06.2019 20:30, daniiltemkin20
List x1, x2, x3, x4 where xi is the left endpoint of the four equal intervals used to estimate the area under the curve of f(x) between x = 4 and x = 6. a 4, 4.5, 5, 5.5 b 4.5, 5, 5.5, 6 c 4.25, 4.75, 5.25, 5.75 d 4, 4.2, 5.4, 6
Answers: 1
Mathematics, 21.06.2019 20:50, brea2006
An automobile assembly line operation has a scheduled mean completion time, μ, of 12 minutes. the standard deviation of completion times is 1.6 minutes. it is claimed that, under new management, the mean completion time has decreased. to test this claim, a random sample of 33 completion times under new management was taken. the sample had a mean of 11.2 minutes. assume that the population is normally distributed. can we support, at the 0.05 level of significance, the claim that the mean completion time has decreased under new management? assume that the standard deviation of completion times has not changed.
Answers: 3
Mathematics, 21.06.2019 21:30, Diamondnado3046
What percent of 18 is 24? and plz explain thx.
Answers: 2
Mathematics, 21.06.2019 22:30, ondreabyes225pcr83r
Adistribution has the five-number summary shown below. what is the third quartile, q3, of this distribution? 22, 34, 41, 55, 62
Answers: 2
You know the right answer?
Questions in other subjects:

History, 27.09.2019 08:50
Mathematics, 27.09.2019 08:50


Biology, 27.09.2019 08:50
Mathematics, 27.09.2019 08:50


