
Mathematics, 10.03.2021 05:00 030702princessjs
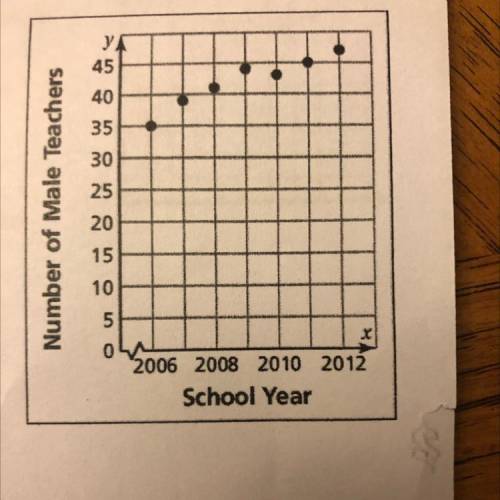
1. The scatter plot show the number of male teachers in a school district from 2006 to 2012. a. In what school year did the school district have 41 male teacher? b. How many male teachers did the district have in the 2012 school year? c. Describe the relationship shown by the data.

Answers: 2


Other questions on the subject: Mathematics
Mathematics, 21.06.2019 16:10, GgRed
Abox contains 1 plain pencil and 4 pens. a second box contains 5 color pencils and 5 crayons. one item from each box is chosen at random. what is the probability that a plain pencil from the first box and a color pencil from the second box are selected? write your answer as a fraction in simplest form.
Answers: 1
Mathematics, 21.06.2019 18:50, xlebrny1215
Which translation maps the vertex of the graph of the function f(x) = x2 onto the vertex of the function g(x) = x2 – 10x +2?
Answers: 1
Mathematics, 21.06.2019 21:40, skylarbrown018
The number of chocolate chips in a bag of chocolate chip cookies is approximately normally distributed with a mean of 12611261 chips and a standard deviation of 118118 chips. (a) determine the 2626th percentile for the number of chocolate chips in a bag. (b) determine the number of chocolate chips in a bag that make up the middle 9696% of bags. (c) what is the interquartile range of the number of chocolate chips in a bag of chocolate chip cookies?
Answers: 2
You know the right answer?
1. The scatter plot show the number of male teachers in a school district from 2006 to 2012. a. In w...
Questions in other subjects:

History, 24.09.2019 04:30

Chemistry, 24.09.2019 04:30

Physics, 24.09.2019 04:30

Mathematics, 24.09.2019 04:30


