.
Mr. Jones filled his swimming pool with water.
Mr. Jones began filling the pool at a consta...

Mathematics, 09.03.2021 08:40 knight5910
.
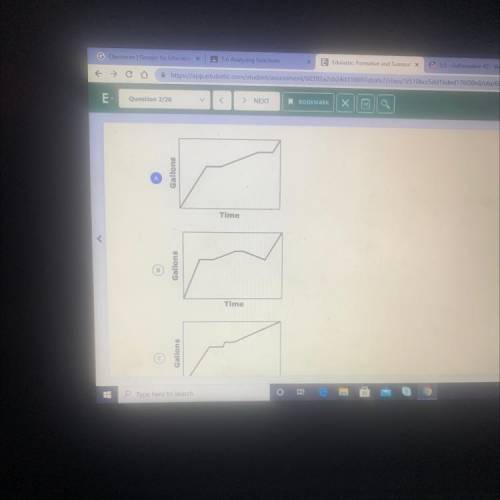
Mr. Jones filled his swimming pool with water.
Mr. Jones began filling the pool at a constant rate.
He turned off the water for a while.
He then turned the water back on at a slower conant rate.
Mr. Jones turned off the water again for a while.
• He then turned the water back on at the first rate.
Which graph best represents Mr. Jones filling the pool?
.
.

Answers: 2


Other questions on the subject: Mathematics
Mathematics, 21.06.2019 18:30, Trinityslater
It says factor each expression completely 8y+48
Answers: 1
Mathematics, 21.06.2019 21:00, Rebelyfe4175
Meghan has created a diagram of her city with her house, school, store, and gym identified. a. how far is it from the gym to the store? b. meghan also wants to walk to get some exercise, rather than going to the gym. she decides to walk along arc ab. how far will she walk? round to 3 decimal places.
Answers: 2
You know the right answer?
Questions in other subjects:
Mathematics, 21.03.2020 08:55


Mathematics, 21.03.2020 08:55


