
Mathematics, 08.03.2021 22:20 amalalghalib14
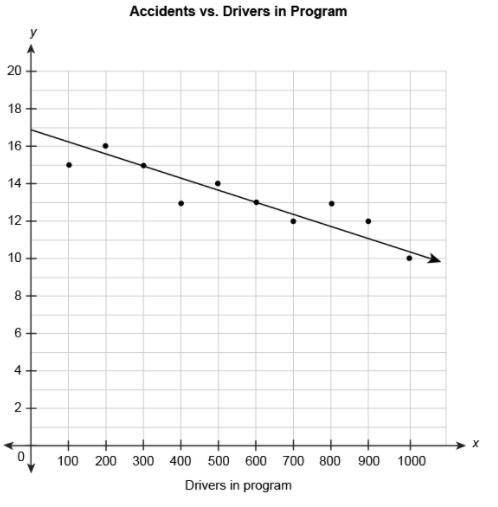
The scatter plot shows the relationship between the number of car accidents in a month and the number of drivers attending a program on distracted driving. The equation represents the linear model for this data.
y=−0.0067x+17
What does the number -0.0067 in the equation mean in this context?
The number of accidents was reduced by 0.67 per month for every additional 100 drivers in the program.
The number of accidents increased by 0.67 per month for every additional 100 drivers in the program.
The number of accidents was reduced by 0.67 per month for every additional driver in the program.
The number of accidents was reduced by 0.67 per month every month.
There were 0.67 accidents per month.
A graph measuring drivers in program in relation to accidents per month. A line indicates that accidents increase as drivers in program decreases.

Answers: 1


Other questions on the subject: Mathematics
Mathematics, 21.06.2019 15:30, nsuleban9524
Astore manager records the total visitors and sales, in dollars, for 10 days. the data is shown in the scatter plot. what conclusion can the store manager draw based on the data? question 3 options: an increase in sales causes a decrease in visitors. an increase in sales is correlated with a decrease in visitors. an increase in visitors is correlated with an increase in sales.
Answers: 1
Mathematics, 21.06.2019 16:20, jsbdbdkdkkd5104
Which of the following lines does not intersect the line y=-2x+3 ? a) y=2x b) y=2x-3 c) y=2x+3 d) y=-2x-3
Answers: 2
Mathematics, 21.06.2019 20:30, kjhgfcvb5761
Solve each quadratic equation by factoring and using the zero product property. [tex]x^2+6x+8=0[/tex]
Answers: 2
Mathematics, 21.06.2019 23:30, teenybug56
If a runner who runs at a constant speed of p miles per hour runs a mile in exactly p minutes what is the integer closest to the value p
Answers: 2
You know the right answer?
The scatter plot shows the relationship between the number of car accidents in a month and the numbe...
Questions in other subjects:

Mathematics, 01.12.2020 04:40

Social Studies, 01.12.2020 04:40

Chemistry, 01.12.2020 04:40


