
Mathematics, 08.03.2021 22:10 quita03
Will mark please only answer if you know
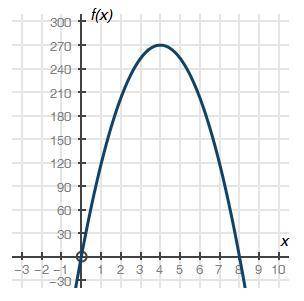
The graph below shows a company's profit f(x), in dollars, depending on the price of erasers x, in dollars, sold by the company:
Part A: What do the x-intercepts and maximum value of the graph represent? What are the intervals where the function is increasing and decreasing, and what do they represent about the sale and profit? (4 points)
Part B: What is an approximate average rate of change of the graph from x = 1 to x = 4, and what does this rate represent? (3 points)
Part C: Describe the constraints of the domain. (3 points)

Answers: 1


Other questions on the subject: Mathematics
Mathematics, 21.06.2019 13:00, masonbitterman7488
Mary had at least an 80% on her test write an inequality to represent this situation
Answers: 2
Mathematics, 21.06.2019 20:00, hlannette7005
Segment an is an altitude of right δabc with a right angle at a. if ab = 2, squared 5 in and nc = 1 in, find bn, an, ac.
Answers: 2
Mathematics, 21.06.2019 23:00, lejeanjamespete1
Graph the system of equations. {6x−4y=−244x−8y=−32 use the line tool to graph the lines.
Answers: 1
You know the right answer?
Will mark please only answer if you know
The graph below shows a company's profit f(x), in dollars,...
Questions in other subjects:
Mathematics, 22.02.2021 19:10

Arts, 22.02.2021 19:10


Chemistry, 22.02.2021 19:10
Mathematics, 22.02.2021 19:10


