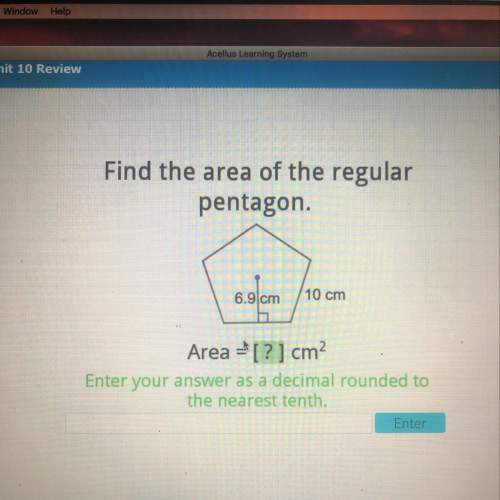
HELP
...

Mathematics, 08.03.2021 19:30 paytonxxburns05
HELP


Answers: 3


Other questions on the subject: Mathematics

Mathematics, 21.06.2019 19:10, jemseidle8889
Click an item in the list or group of pictures at the bottom of the problem and, holding the button down, drag it into the correct position in the answer box. release your mouse button when the item is place. if you change your mind, drag the item to the trashcan. click the trashcan to clear all your answers. solve this quadratic equation using the quadratic formula. 2x2 - 2x=1 need asap
Answers: 2

Mathematics, 21.06.2019 21:00, carissaprocacci
Tessa bought stock in a restaurant for $253.00. her stock is now worth $333.96. what is the percentage increase of the value of tessa's stock? a.) 81% b.) 32% c.) 24% d.) 76%
Answers: 1

Mathematics, 21.06.2019 22:20, stalley1521
Which of the following is missing in the explicit formula for the compound interest geometric sequence below?
Answers: 1

Mathematics, 22.06.2019 01:00, s27511583
The weight of 46 new patients of a clinic from the year 2018 are recorded and listed below. construct a frequency distribution, using 7 classes. then, draw a histogram, a frequency polygon, and an ogive for the data, using the relative information from the frequency table for each of the graphs. describe the shape of the histogram. data set: 130 192 145 97 100 122 210 132 107 95 210 128 193 208 118 196 130 178 187 240 90 126 98 194 115 212 110 225 187 133 220 218 110 104 201 120 183 124 261 270 108 160 203 210 191 180 1) complete the frequency distribution table below (add as many rows as needed): - class limits - class boundaries - midpoint - frequency - cumulative frequency 2) histogram 3) frequency polygon 4) ogive
Answers: 1
You know the right answer?
Questions in other subjects:


Mathematics, 24.06.2020 22:01


Mathematics, 24.06.2020 22:01


