
Mathematics, 08.03.2021 19:00 charisaramsey
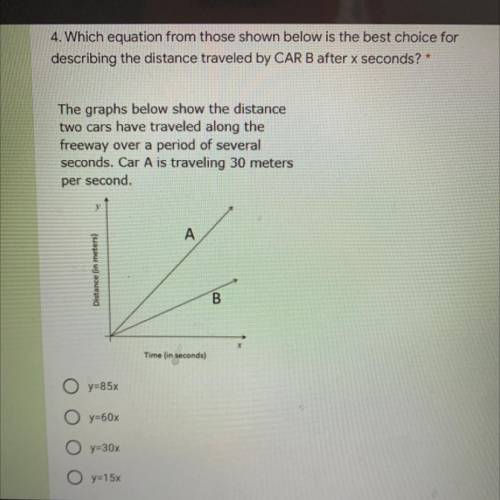
Which equation from those shown below is the best choice for describing the distance traveled by CAR B after x seconds. The graph below shows the distance two cars have traveled along the freeway over a period of several seconds. Car A is traveling 30 meters per second.

Answers: 3


Other questions on the subject: Mathematics
Mathematics, 21.06.2019 16:30, 2alshawe201
You are remodeling your kitchen. you’ve contacted two tiling companies who gladly told you how long it took their workers to tile of a similar size jim completed half the floor in 8 hours. pete completed half of the other floor in 7 hours. if pete can lay 20 more tiles per hour than jim, at what rate can jim lay tiles
Answers: 3
Mathematics, 21.06.2019 16:30, robclark128
You are updating your garage and the only thing left to paint is your garage day. you're only going to paint the slide that faces the street. the garage door is 9 fert 8inches tall and 120 inches wide. you need to know the surface area of the side of the garage door to determine how much paint to buy. the hardware store sells paint by how much covers a square foot. what is the surface area you should report to the hardware store what is the answer
Answers: 3
Mathematics, 21.06.2019 18:30, travorissteele822
The table shows the relationship between the number of cups of cereal and the number of cups of raisins in a cereal bar recipe: number of cups of cereal number of cups of raisins 8 2 12 3 16 4 molly plotted an equivalent ratio as shown on the grid below: a graph is shown. the title of the graph is cereal bars. the horizontal axis label is cereal in cups. the x-axis values are 0, 20, 40, 60, 80,100. the vertical axis label is raisins in cups. the y-axis values are 0, 10, 20, 30, 40, 50. a point is plotted on the ordered pair 40,20. which of these explains why the point molly plotted is incorrect? (a) if the number of cups of cereal is 40, then the number of cups of raisins will be10. (b)if the number of cups of raisins is 40, then the number of cups of cereal will be10. (c) if the number of cups of cereal is 40, then the number of cups of raisins will be 80. (d) if the number of cups of raisins is 40, then the number of cups of cereal will be 80.
Answers: 1
You know the right answer?
Which equation from those shown below is the best choice for describing the distance traveled by CAR...
Questions in other subjects:

Mathematics, 12.03.2020 20:06


History, 12.03.2020 20:06


