
Mathematics, 08.03.2021 01:20 tiffanyrenee3355
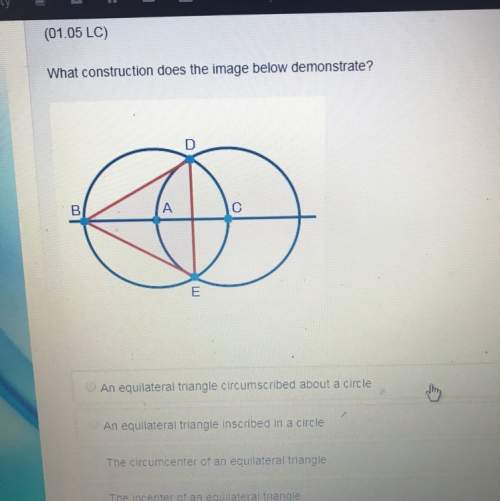
A survey of 500 people was conducted to determine which night the largest number of viewers prefer to watch television. The graph below represents
the data
Best Television Night
Saturday
12%
Monday
Sunday
20%
18%
Wednesday
Thursday
15%
12%
Friday Tuesday
15%
8%
Based on the data in the circle graph, how many more people preferred to watch television on Monday night that the number of people who preferred to
watch television on Thursday night?
210
100
40
60

Answers: 3


Other questions on the subject: Mathematics
Mathematics, 21.06.2019 14:30, ayoismeisjjjjuan
If anyone has done the algebra 2 chaos theory portfolio would you be wiling to me? i kind of know what i'm doing i just don't know if i'm doing it right.
Answers: 1
Mathematics, 21.06.2019 19:00, Brendah4962
Solve the equation using the zero-product property. -3n(7n - 5) = 0 a. 0, -5/7 b. -1/3, -5/7 c. -1/3, 5/7 d. 0, 5/7
Answers: 2
Mathematics, 21.06.2019 21:00, arizmendiivan713
*let m∠cob = 50°30’, m∠aob = 70° and m∠aoc = 20°30’. could point c be in the interior of ∠aob? why?
Answers: 1
Mathematics, 21.06.2019 23:00, Ellafrederick
Janie has $3. she earns $1.20 for each chore she does and can do fractions of chores. she wants to earn enough money to buy a cd for $13.50.
Answers: 2
You know the right answer?
A survey of 500 people was conducted to determine which night the largest number of viewers prefer t...
Questions in other subjects:


Mathematics, 05.07.2019 23:10

Mathematics, 05.07.2019 23:10


