Mathematics, 07.03.2021 23:10 Geo777
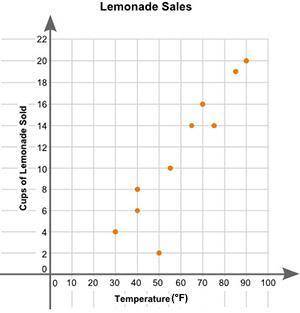
(06.02)Eric plotted the graph below to show the relationship between the temperature of his city and the number of cups of lemonade he sold daily: Part B: Describe how you can make the line of best fit. Write the approximate slope and y-intercept of the line of best fit. Show your work, including the points that you use to calculate the slope and y-intercept. (3 points)


Answers: 1


Other questions on the subject: Mathematics

Mathematics, 21.06.2019 20:30, amandaaaa13
Asmall business produces and sells balls. the fixed costs are $20 and each ball costs $4.32 to produce. each ball sells for $8.32. write the equations for the total cost, c, and the revenue, r, then use the graphing method to determine how many balls must be sold to break even.
Answers: 1


Mathematics, 21.06.2019 22:30, nane718
According to the 2008 u. s. census, california had a population of approximately 4 × 10^7 people and florida had a population of approximately 2 × 10^7 people. which of the following is true? a. the population of california was approximately two times the population of florida. b. the population of florida was approximately twenty times the population of california. c. the population of florida was approximately two times the population of california. d. the population of california was approximately twenty times the population of florida.
Answers: 1

Mathematics, 21.06.2019 23:00, CelesteN64
In trapezoid abcd, ac is a diagonal and ∠abc≅∠acd. find ac if the lengths of the bases bc and ad are 12m and 27m respectively.
Answers: 3
You know the right answer?
(06.02)Eric plotted the graph below to show the relationship between the temperature of his city and...
Questions in other subjects:


Mathematics, 08.02.2021 18:30

Biology, 08.02.2021 18:30

History, 08.02.2021 18:30


English, 08.02.2021 18:30

Mathematics, 08.02.2021 18:30


