
Mathematics, 06.03.2021 01:40 esnyderquintero
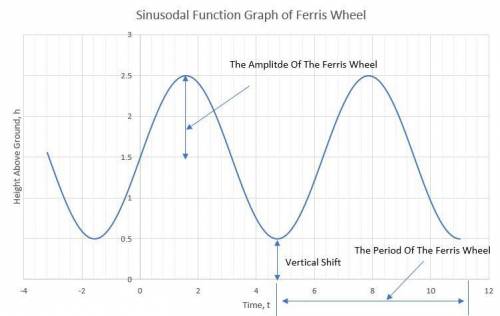
Sinusoidal graphs may occur in everyday life. Examples of sinusoidal graphs can be found in wave patterns, temperature patterns over extended period of times, or the pattern of swinging on a tree.
Required:
a. Find a real-world situation that can be represented by a sinusoidal function. You may find something online that represents a sinusoidal graph or you can create a sinusoidal graph yourself with a measuring tape and a rope.
b. Provide a graph complete with labels and units for the x- and y-axes.
c. Describe the amplitude, period, and vertical shift in terms of the real-world situation.

Answers: 2


Other questions on the subject: Mathematics
Mathematics, 21.06.2019 17:00, laylay7383
The table below shows the height of a ball x seconds after being kicked. what values, rounded to the nearest whole number, complete the quadratic regression equation that models the data? f(x) = x2 + x + 0based on the regression equation and rounded to the nearest whole number, what is the estimated height after 0.25 seconds? feet
Answers: 2
Mathematics, 21.06.2019 18:50, trevionc0322
Which of the following values cannot be probabilities? 0.08, 5 divided by 3, startroot 2 endroot, negative 0.59, 1, 0, 1.44, 3 divided by 5 select all the values that cannot be probabilities. a. five thirds b. 1.44 c. 1 d. startroot 2 endroot e. three fifths f. 0.08 g. 0 h. negative 0.59
Answers: 2
You know the right answer?
Sinusoidal graphs may occur in everyday life. Examples of sinusoidal graphs can be found in wave pat...
Questions in other subjects:

Mathematics, 10.06.2020 18:57
Mathematics, 10.06.2020 18:57

Physics, 10.06.2020 18:57

Mathematics, 10.06.2020 18:57


