
Mathematics, 05.03.2021 23:10 jadentdaniels
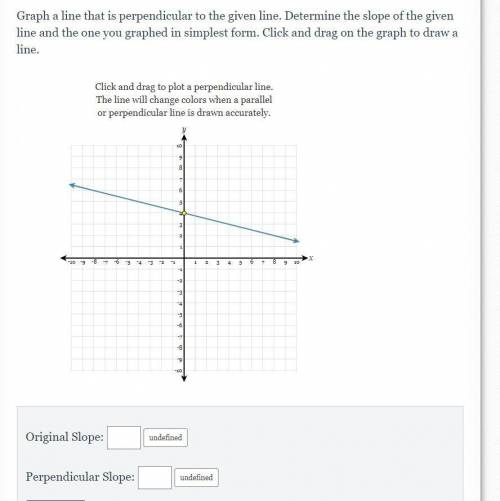
Graph a line that is perpendicular to the given line. Determine the slope of the given line and the one you graphed in simplest form. Click and drag on the graph to draw a line.

Answers: 3


Other questions on the subject: Mathematics
Mathematics, 21.06.2019 16:30, jessica01479
Scale factor of 2 is used to enlarge a figure as shown below the area of is 18 in.²
Answers: 3
Mathematics, 21.06.2019 20:30, ElegantEmerald
A. plot the data for the functions f(x) and g(x) on a grid and connect the points. x -2 -1 0 1 2 f(x) 1/9 1/3 1 3 9 x -2 -1 0 1 2 g(x) -4 -2 0 2 4 b. which function could be described as exponential and which as linear? explain. c. if the functions continue with the same pattern, will the function values ever be equal? if so, give estimates for the value of x that will make the function values equals. if not, explain why the function values will never be equal.
Answers: 3
You know the right answer?
Graph a line that is perpendicular to the given line. Determine the slope of the given line and the...
Questions in other subjects:
Mathematics, 21.11.2020 08:30

English, 21.11.2020 08:30
Mathematics, 21.11.2020 08:30

Mathematics, 21.11.2020 08:30

Computers and Technology, 21.11.2020 08:30


