
3. a. What trend line, in slope-intercept form, models the data
from the Example 2 Try it?
b....

Mathematics, 05.03.2021 19:40 areeves39276
3. a. What trend line, in slope-intercept form, models the data
from the Example 2 Try it?
b. Explain why there could be no data points on a trend line,
yet the line models the data.
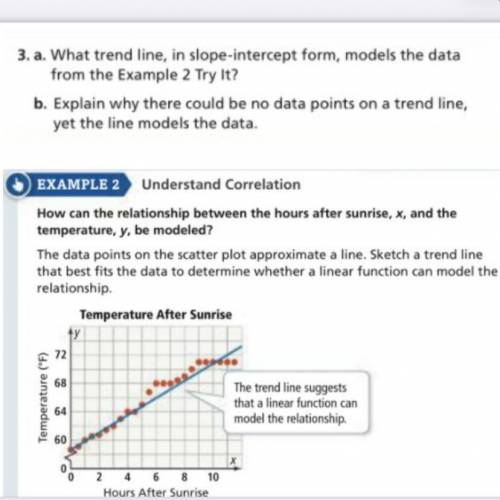
EXAMPLE 2 Understand Correlation
How can the relationship between the hours after sunrise, x, and the
temperature, y. be modeled?
The data points on the scatter plot approximate a line. Sketch a trend line
that best fits the data to determine whether a linear function can model the
relationship
Temperature After Sunrise
dy
72
I
68
Temperature (7)
The trend line suggests
that a linear function can
model the relationship
64
60
2 4 6 8 10
Hours After Sunrise

Answers: 2


Other questions on the subject: Mathematics
Mathematics, 21.06.2019 14:20, christingle2004
Ac contractor is building a new subdivision outside of the city. he has started work on the first street and is planning on the other streets to run in a direction parallel to the first. the second street will pass through (-2,4) find the equation of the location of the second street in standard form. a.2x+y=2 b. x-y=2 c.2x+y=2 d. x+y=2
Answers: 2
Mathematics, 21.06.2019 17:30, jessied2000
What is not true about kl and mn? what is mn? (show your work)
Answers: 1
Mathematics, 21.06.2019 19:30, cykopath
Me max recorded the heights of 500 male humans. he found that the heights were normally distributed around a mean of 177 centimeters. which statements about max’s data must be true? a) the median of max’s data is 250 b) more than half of the data points max recorded were 177 centimeters. c) a data point chosen at random is as likely to be above the mean as it is to be below the mean. d) every height within three standard deviations of the mean is equally likely to be chosen if a data point is selected at random.
Answers: 2
You know the right answer?
Questions in other subjects:


Mathematics, 02.09.2019 15:30


Geography, 02.09.2019 15:30


Chemistry, 02.09.2019 15:30


