3. a. What trend line, in slope-intercept form, models the data
from the Example 2 Try it?
b....

Mathematics, 05.03.2021 19:40 kaylarose7658
3. a. What trend line, in slope-intercept form, models the data
from the Example 2 Try it?
b. Explain why there could be no data points on a trend line,
yet the line models the data.
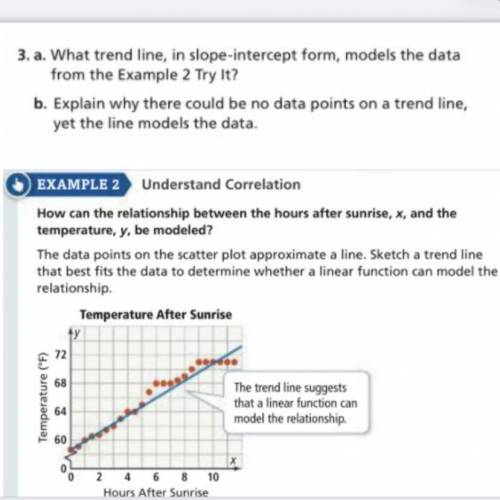
EXAMPLE 2 Understand Correlation
How can the relationship between the hours after sunrise, x, and the
temperature, y. be modeled?
The data points on the scatter plot approximate a line. Sketch a trend line
that best fits the data to determine whether a linear function can model the
relationship
Temperature After Sunrise
dy
72
I
68
Temperature (7)
The trend line suggests
that a linear function can
model the relationship
64
60
2 4 6 8 10
Hours After Sunrise

Answers: 3


Other questions on the subject: Mathematics
Mathematics, 21.06.2019 20:30, ElegantEmerald
A. plot the data for the functions f(x) and g(x) on a grid and connect the points. x -2 -1 0 1 2 f(x) 1/9 1/3 1 3 9 x -2 -1 0 1 2 g(x) -4 -2 0 2 4 b. which function could be described as exponential and which as linear? explain. c. if the functions continue with the same pattern, will the function values ever be equal? if so, give estimates for the value of x that will make the function values equals. if not, explain why the function values will never be equal.
Answers: 3
Mathematics, 21.06.2019 21:30, billydeck30
Amachine part consists of a half sphere and a cylinder, as shown in the figure. the total volume of the part is π cubic inches.
Answers: 1
You know the right answer?
Questions in other subjects:
Mathematics, 20.09.2019 06:30

History, 20.09.2019 06:30

Computers and Technology, 20.09.2019 06:30
Mathematics, 20.09.2019 06:30
Mathematics, 20.09.2019 06:30


Geography, 20.09.2019 06:30


