
Mathematics, 05.03.2021 18:10 guillmar003
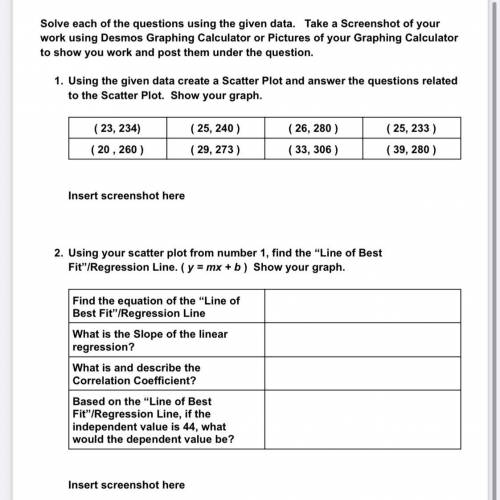
Solve each of the questions using the given data. Take a Screenshot of your work using Desmos Graphing Calculator or Pictures of your Graphing Calculator to show you work and post them under the question.

Answers: 3


Other questions on the subject: Mathematics
Mathematics, 21.06.2019 13:30, Lovergirl13
The triangles are similar. what is the value of x? x=
Answers: 1
Mathematics, 21.06.2019 15:30, Fireburntbudder
If x + 10 = 70, what is x? a. 40 b. 50 c. 60 d. 70 e. 80
Answers: 2
Mathematics, 21.06.2019 16:30, jayjay5246
Translate this phrase into an algebraic expression. 21 more than twice goran's savings use the variable g to represent goran's savings. need to know fast.
Answers: 1
Mathematics, 21.06.2019 17:00, hsernaykaw42
Use the frequency distribution, which shows the number of american voters (in millions) according to age, to find the probability that a voter chosen at random is in the 18 to 20 years old age range. ages frequency 18 to 20 5.9 21 to 24 7.7 25 to 34 20.4 35 to 44 25.1 45 to 64 54.4 65 and over 27.7 the probability that a voter chosen at random is in the 18 to 20 years old age range is nothing. (round to three decimal places as needed.)
Answers: 1
You know the right answer?
Solve each of the questions using the given data. Take a Screenshot of your work using Desmos Graphi...
Questions in other subjects:
Mathematics, 11.06.2021 17:30


English, 11.06.2021 17:30

Chemistry, 11.06.2021 17:30

Mathematics, 11.06.2021 17:30


