
Mathematics, 05.03.2021 14:00 melissapulido198
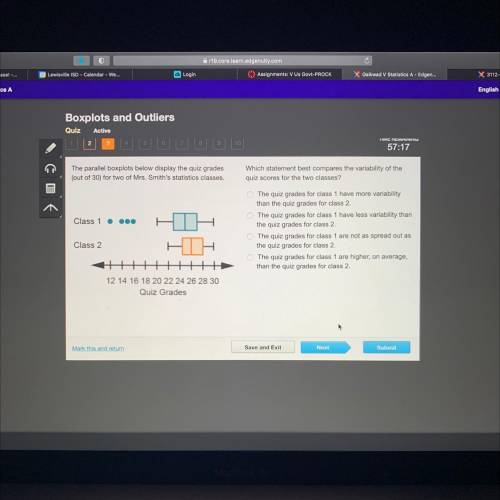
The parallel boxplots below display the quiz grades
(out of 30) for two of Mrs. Smith's statistics classes.
Which statement best compares the variability of the
quiz scores for the two classes?
Class 1 000
O The quiz grades for class 1 have more variability
than the quiz grades for class 2.
The quiz grades for class 1 have less variability than
the quiz grades for class 2.
The quiz grades for class 1 are not as spread out as
the quiz grades for class 2.
O The quiz grades for class 1 are higher, on average,
than the quiz grades for class 2.
Class 2
+
12 14 16 18 20 22 24 26 28 30
Quiz Grades

Answers: 3


Other questions on the subject: Mathematics
Mathematics, 21.06.2019 17:30, cxttiemsp021
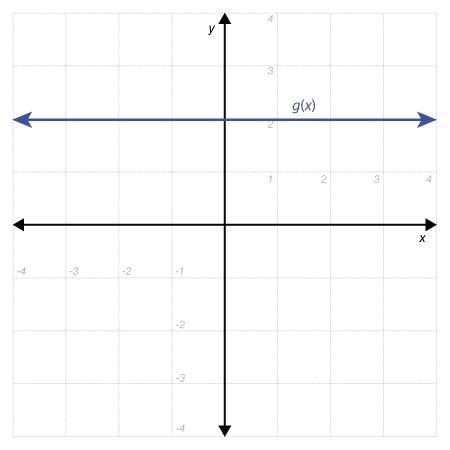
Is appreciated! graph the functions and approximate an x-value in which the exponential function surpasses the polynomial function. f(x) = 4^xg(x) = 4x^2options: x = -1x = 0x = 1x = 2
Answers: 1
Mathematics, 21.06.2019 18:30, amorosoavap5cejz
You receive 15% of the profit from a car wash how much money do you receive from a profit of 300
Answers: 2
Mathematics, 21.06.2019 20:30, ElegantEmerald
A. plot the data for the functions f(x) and g(x) on a grid and connect the points. x -2 -1 0 1 2 f(x) 1/9 1/3 1 3 9 x -2 -1 0 1 2 g(x) -4 -2 0 2 4 b. which function could be described as exponential and which as linear? explain. c. if the functions continue with the same pattern, will the function values ever be equal? if so, give estimates for the value of x that will make the function values equals. if not, explain why the function values will never be equal.
Answers: 3
You know the right answer?
The parallel boxplots below display the quiz grades
(out of 30) for two of Mrs. Smith's statistics...
Questions in other subjects:
Mathematics, 22.01.2021 21:50

Mathematics, 22.01.2021 21:50
Mathematics, 22.01.2021 21:50
Mathematics, 22.01.2021 21:50

Mathematics, 22.01.2021 21:50


