
Mathematics, 05.03.2021 05:40 1937
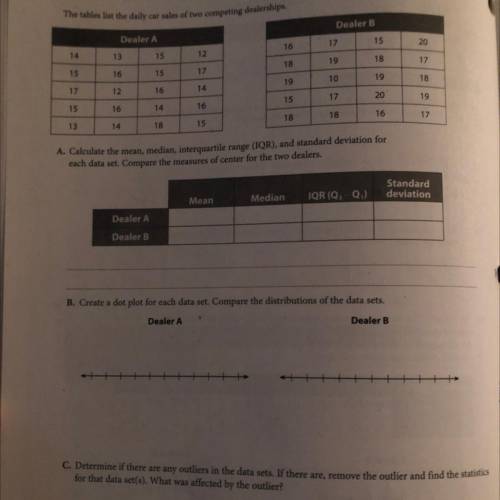
A. Calculate the mean, median, interquartile range (IQR), and standard deviation for
each data set Compare the measures of center for the two dealers.
B. Create the plot for each set. Compare the distribution of the data set.
C. determine if there any outliers in the data sets. If they are, remove the outlier and find a sister sticks for the data sets. What was affected by the outlier?

Answers: 2


Other questions on the subject: Mathematics
Mathematics, 21.06.2019 18:30, viktoria1198zz
Florence price's brownies and more sells all types of cookies and pastries. on tuesdays, they markdown all brownies 75% to a sale of $1.50 a dozen. find the selling price and the markdown of a dozen brownies.
Answers: 1
You know the right answer?
A. Calculate the mean, median, interquartile range (IQR), and standard deviation for
each data set...
Questions in other subjects:
Mathematics, 13.11.2020 22:30

English, 13.11.2020 22:30
English, 13.11.2020 22:30
English, 13.11.2020 22:30

Mathematics, 13.11.2020 22:30


