
Mathematics, 05.03.2021 01:00 isabelperez063
8
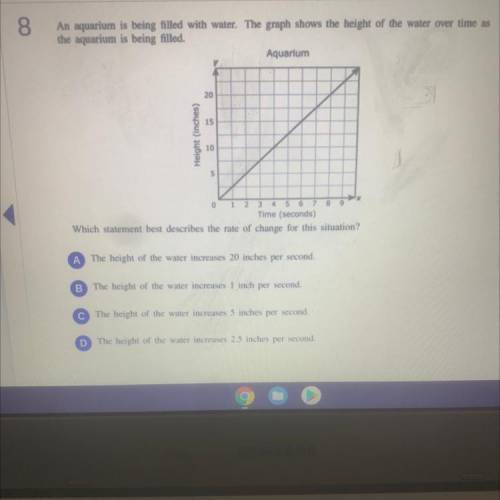
An aquarium is being filled with water. The graph shows the height of the water over time as
the aquarium is being filled.
Aquarium
20
15
Height (inches)
10
5
8
9
0 1 2 3 4 5 6 7
Time (seconds)
Which statement best describes the rate of change for this situation?
A The height of the water increases 20 inches per second,
B The height of the water increases 1 inch per second.
The height of the water increases 5 inches per second.
D The height of the water increases 2.5 inches per second.

Answers: 2


Other questions on the subject: Mathematics
Mathematics, 21.06.2019 20:00, chantelljenkins2
True or false: the graph of y=f(bx) is a horizontal compression of the graph y=f(x) if b< 1
Answers: 2
Mathematics, 21.06.2019 22:10, Jenifermorales101
Write the function for the graph. (1.8) (0,4)
Answers: 3
Mathematics, 22.06.2019 02:10, kinqlouiee2253
Of jk j(–25, 10) k(5, –20). is y- of l, jk a 7: 3 ? –16 –11 –4 –1
Answers: 1
You know the right answer?
8
An aquarium is being filled with water. The graph shows the height of the water over time as
Questions in other subjects:
Mathematics, 03.07.2019 22:00


Mathematics, 03.07.2019 22:00
Mathematics, 03.07.2019 22:00
Chemistry, 03.07.2019 22:00


