
Mathematics, 04.03.2021 20:00 cammie5292
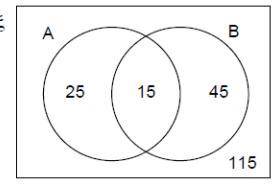
The Venn diagram shows the number of left-handed students (A) and vegetarians (B) in the same
year group.
(a) Write down P(A∩B) _
(b) How many students are in the year group? _
(c) A student is chosen at random. What is the probability that
they are a right-handed vegetarian?

Answers: 2


Other questions on the subject: Mathematics
Mathematics, 22.06.2019 02:00, b2cutie456
Emily convinced her mom to buy a giant box of her favorite cereal. her mom doesn't think the box will fit on their shelf. the volume of the box is 1000 cm^3 . the base of the box is 25 cm by 10 cm
Answers: 1
You know the right answer?
The Venn diagram shows the number of left-handed students (A) and vegetarians (B) in the same
year...
Questions in other subjects:


Mathematics, 02.09.2020 04:01

Chemistry, 02.09.2020 04:01


