
Mathematics, 04.03.2021 19:30 ellie55991
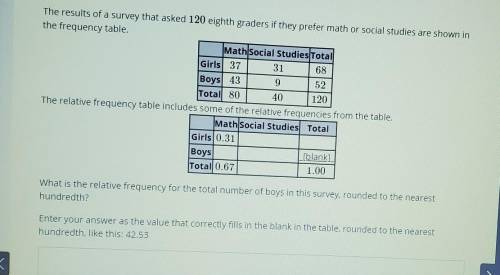
The results of a survey that asked 120 eighth graders if they prefer math or social studies are shown in the frequency table. Math Social Studies Total Girls 37 31 68 Boys 43 9 52 Total 80 40 120 The relative frequency table includes some of the relative frequencies from the table. Math Social Studies Total Girls 0.31 Boys [blank] Total 0.67 1.00 What is the relative frequency for the total number of boys in this survey, rounded to the nearest hundredth? Enter your answer as the value that correctly fills in the blank in the table, rounded to the nearest hundredth, like this: 42.53

Answers: 1


Other questions on the subject: Mathematics
Mathematics, 21.06.2019 23:30, xandraeden32
Consider the first four terms of the sequence below. what is the 8th term of this sequence?
Answers: 1
You know the right answer?
The results of a survey that asked 120 eighth graders if they prefer math or social studies are show...
Questions in other subjects:

Physics, 22.09.2019 19:00

Geography, 22.09.2019 19:00


History, 22.09.2019 19:00


Chemistry, 22.09.2019 19:00


