
Mathematics, 04.03.2021 18:50 july00
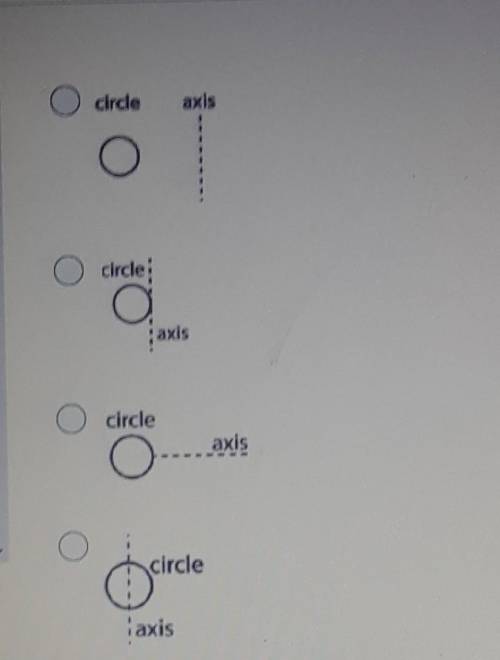
Look at this figure of a doughnut shape with a central opening. Each of the following diagrams shows a circle and a broken link representing an axis of rotation. Which diagram shows a figure that, when the circle is rotated around the axis in the orientation shown, generates the figure above?

Answers: 2


Other questions on the subject: Mathematics
Mathematics, 21.06.2019 23:40, preciosakassidy
The frequency table shows the results of a survey asking people how many hours they spend online per week. on a piece of paper, draw a histogram to represent the data. then determine which answer choice matches the histogram you drew. in order here is the.. hours online: 0-3, 4-7, 8-11, 12-15, and 16-19. frequency: 5, 8, 10, 8, 7 answer for the question is in the picture! : )
Answers: 2
You know the right answer?
Look at this figure of a doughnut shape with a central opening. Each of the following diagrams shows...
Questions in other subjects:


Arts, 08.03.2021 04:50
History, 08.03.2021 04:50


Physics, 08.03.2021 04:50
Mathematics, 08.03.2021 04:50
SAT, 08.03.2021 04:50

Spanish, 08.03.2021 04:50


