
Mathematics, 04.03.2021 03:00 savjk74
Help please!
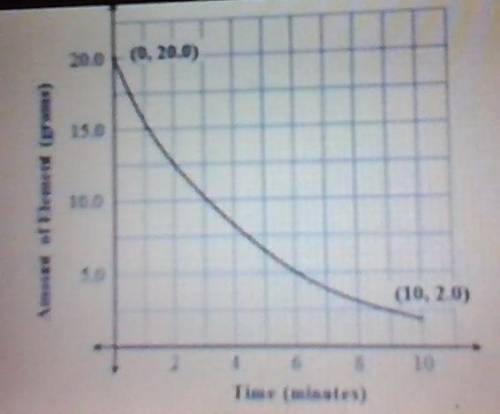
The graph models the amount of radioactive element present over the course of a 10-minute experiment.
What is the average rate of change of the amount of the element over the 10-minute experiment?
A.
-1.8 g/min
B.
-2.0 g/min
C.
-5.0 g/min
D.
-0.2 g/min

Answers: 3


Other questions on the subject: Mathematics
Mathematics, 21.06.2019 16:20, tmantooth7018
The lengths of nails produced in a factory are normally distributed with a mean of 4.91 centimeters and a standard deviation of 0.05 centimeters. find the two lengths that separate the top 4% and the bottom 4%. these lengths could serve as limits used to identify which nails should be rejected. round your answer to the nearest hundredth, if necessary.
Answers: 3
Mathematics, 21.06.2019 18:30, ashleytellez
41/17 as a decimal rounded to the nearest hundredth
Answers: 1
Mathematics, 21.06.2019 20:00, demetriascott20
Write the point-slope form of the line passing through (2, -12) and parallel to y=3x.
Answers: 2
Mathematics, 21.06.2019 21:50, libi052207
Free points also plz look my profile and answer really stuff
Answers: 2
You know the right answer?
Help please!
The graph models the amount of radioactive element present over the course of a 10-min...
Questions in other subjects:

Mathematics, 25.05.2021 19:20
Mathematics, 25.05.2021 19:20

Social Studies, 25.05.2021 19:20
Mathematics, 25.05.2021 19:20

Chemistry, 25.05.2021 19:20


