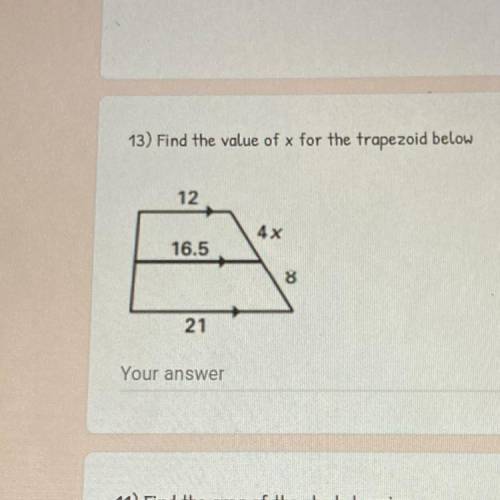
13) Find the value of x for the trapezoid below
12
4x
16.5
30
21
...

Mathematics, 03.03.2021 19:50 DineroLaForeign
13) Find the value of x for the trapezoid below
12
4x
16.5
30
21
Your answer

Answers: 2


Other questions on the subject: Mathematics
Mathematics, 21.06.2019 17:10, tdahna0403
The graph of g(x) is a translation of y = which equation represents g(x)?
Answers: 1
Mathematics, 21.06.2019 18:30, FailingstudentXD
Do some research and find a city that has experienced population growth. determine its population on january 1st of a certain year. write an exponential function to represent the city’s population, y, based on the number of years that pass, x after a period of exponential growth. describe the variables and numbers that you used in your equation.
Answers: 3
Mathematics, 21.06.2019 19:00, lightning1157blaze
The ratio of the measures of the three angles in a triangle is 2: 9: 4. find the measures of the angels
Answers: 2
You know the right answer?
Questions in other subjects:

Mathematics, 01.04.2020 05:21

World Languages, 01.04.2020 05:21
Mathematics, 01.04.2020 05:21

Chemistry, 01.04.2020 05:21
Mathematics, 01.04.2020 05:21
Mathematics, 01.04.2020 05:21
English, 01.04.2020 05:21


