
Mathematics, 03.03.2021 08:10 juan3937
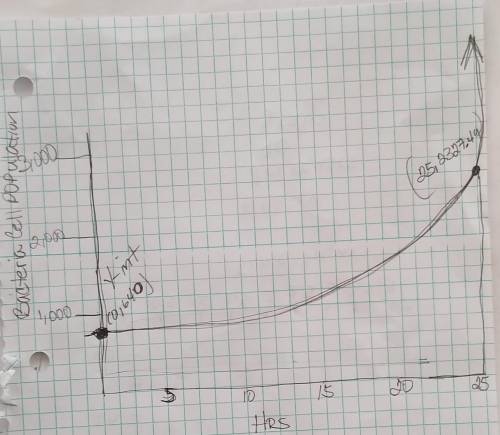
James did an experiment. He started out with 640 bacteria cells. He found that the growth rate of the bacteria
cells was 5.3%. Sketch the graph that represents the situation. Label the y-intercept and the point that
represents the projected bacteria population 25 h from the time James started the experiment.
Plz send graph

Answers: 2


Other questions on the subject: Mathematics
Mathematics, 22.06.2019 01:30, QuestionsAnsweredNow
The actual length of side y is 22 cm. use the scale drawing to find the actual length of side x. a) 15.2 cm b) 17.1 cm c) 18.0 cm d) 28.3 cm
Answers: 1
You know the right answer?
James did an experiment. He started out with 640 bacteria cells. He found that the growth rate of th...
Questions in other subjects:

Mathematics, 13.03.2020 00:18

Mathematics, 13.03.2020 00:18
Mathematics, 13.03.2020 00:18
Mathematics, 13.03.2020 00:19


