Practice
1. Analyze the graphs of the functions f(x) and g(x).
a. Write the equation for f(x)...

Mathematics, 02.03.2021 21:30 adamkinney6110
Practice
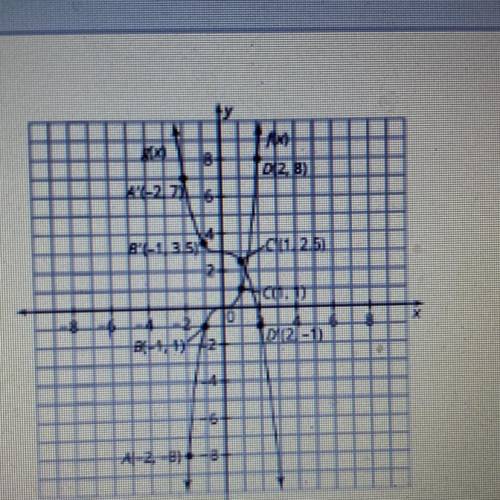
1. Analyze the graphs of the functions f(x) and g(x).
a. Write the equation for f(x).
b. The function g(x) is a transformation of the function f(x).
Describe the transformations performed
on f(x) that result in the function g(x). Explain
your reasoning
c. Write the equation for g(x).
d. Is the function g(x) even, odd, or neither? Explain
your reasoning.

Answers: 1


Other questions on the subject: Mathematics
Mathematics, 21.06.2019 20:30, cogger9348
3.17 scores on stats final. below are final exam scores of 20 introductory statistics students. 1 2 3 4 5 6 7 8 9 10 11 12 13 14 15 16 17 18 19 20 57, 66, 69, 71, 72, 73, 74, 77, 78, 78, 79, 79, 81, 81, 82, 83, 83, 88, 89, 94 (a) the mean score is 77.7 points. with a standard deviation of 8.44 points. use this information to determine if the scores approximately follow the 68-95-99.7% rule. (b) do these data appear to follow a normal distribution? explain your reasoning using the graphs provided below.
Answers: 1
Mathematics, 21.06.2019 21:00, Mathcat444
The zoo collects $9.60 for every 24 tickets sold. how much will be collected for 400 tickets?
Answers: 2
Mathematics, 21.06.2019 22:00, hannahpalmario
The customer price index(cpi), which measures the cost of a typical package of customer goods, was 208.8 in 2011 and 244.1 in 2016.let x=11 corresponding to the year 2011 an estimate to cpi into 2013 and 2014. assume that the data can be modeled by a straight line and the trend to continue idenfinitely. use data points to find such a line and then estimate the requested quantities
Answers: 1
You know the right answer?
Questions in other subjects:
Mathematics, 18.12.2021 22:10

Health, 18.12.2021 22:10

Mathematics, 18.12.2021 22:10

Chemistry, 18.12.2021 22:10

Social Studies, 18.12.2021 22:10
Biology, 18.12.2021 22:10
Mathematics, 18.12.2021 22:10


