
Mathematics, 02.03.2021 20:30 gingerham1
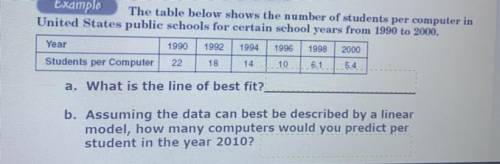
The table below shows the number of students per computer
United States public schools for certain school years from 1990 to 2000.
Year
1990 1992 1994 1996 1998 2000
Students per Computer
22
18
14
10
6.1
5.4
a. What is the line of best fit?
b. Assuming the data can best be described by a linear
model, how many computers would you predict per
student in the year 2010?

Answers: 2


Other questions on the subject: Mathematics
Mathematics, 21.06.2019 20:40, vanitycarraway2000
Which table represents points on the graph of h(x) = 3√-x+2?
Answers: 3
Mathematics, 21.06.2019 21:30, BARRION1981
Over the course of the school year, you keep track of how much snow falls on a given day and whether it was a snow day. your data indicates that of twenty-one days with less than three inches of snow, five were snow days, while of the eight days with more than three inches of snow, six were snow days. if all you know about a day is that it is snowing, what is the probability that it will be a snow day?
Answers: 1
Mathematics, 22.06.2019 00:30, Ramirez72
If you were constructing a triangular frame, and you had wood in the length of 4inches, 4 inches, and 7 inches, would it make a triangle? would you be able to create a frame from these pieces of wood? yes or no. explain your mathematical thinking
Answers: 2
You know the right answer?
The table below shows the number of students per computer
United States public schools for certain...
Questions in other subjects:

Spanish, 05.03.2021 19:40

Mathematics, 05.03.2021 19:40

Mathematics, 05.03.2021 19:40
Mathematics, 05.03.2021 19:40
Mathematics, 05.03.2021 19:40


