
Mathematics, 02.03.2021 18:00 mclendenen8011
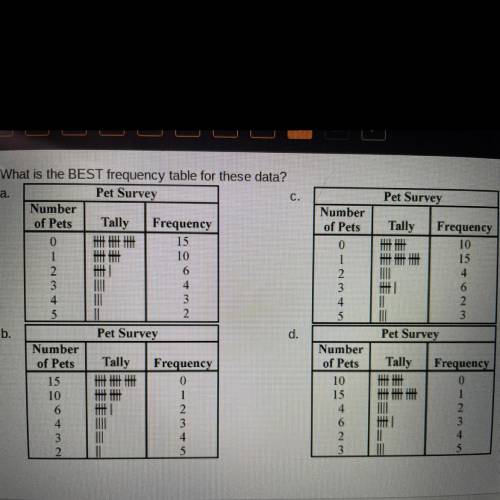
Forty people were randomly sampled and surveyed as to the number of pets in their householdThe results are listed below
1 1 0 4 1 0 1 2
3 5 2 0 2 0 3 1
2 0 0 1 0 4 0 0
3 1 0 0 2 1 0 0
4 0 1 3 5 0 2 1
What is the BEST frequency table for these data?

Answers: 3


Other questions on the subject: Mathematics
Mathematics, 21.06.2019 17:00, tifftiff22
The volume of a cube is 8 in to the 3rd power. how long is each side?
Answers: 1
Mathematics, 21.06.2019 20:00, baileybryant580
Describe a situation that you could represent with the inequality x< 17
Answers: 2
You know the right answer?
Forty people were randomly sampled and surveyed as to the number of pets in their householdThe resul...
Questions in other subjects:

Mathematics, 09.10.2021 14:00

Physics, 09.10.2021 14:00

Mathematics, 09.10.2021 14:00


