
Mathematics, 02.03.2021 06:20 lilly9240
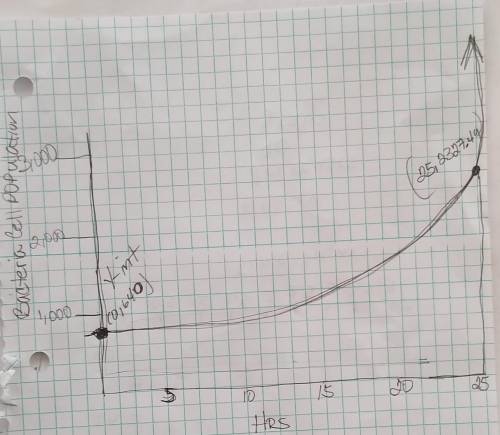
60 Points please answer quickly James did an experiment. He started out with 640 bacteria cells. He found that the growth rate of the bacteria cells was 5.3%. Sketch the graph that represents the situation. Label the y-intercept and the point that represents the projected bacteria population 25 h from the time James started the experiment.

Answers: 3


Other questions on the subject: Mathematics
Mathematics, 21.06.2019 15:30, potato1458
What is the best reason for jacinta to have a savings account in addition to a checking account
Answers: 1
Mathematics, 21.06.2019 16:30, dimpleschris101
Marco is studying a type of mold that grows at a fast rate. he created the function f(x) = 345(1.30)x to model the number of mold spores per week. what does the 1.30 represent? how many mold spores are there after 4 weeks? round your answer to the nearest whole number. 1.30 represents the number of mold spores marco had at the beginning of the study; 985 mold spores 1.30 represents the number of mold spores grown in a given week; 448 mold spores 1.30 represents the 30% rate of weekly growth; 345 mold spores 1.30 represents the 30% rate of weekly growth; 985 mold spores
Answers: 1
Mathematics, 21.06.2019 19:00, heartykwarteng12
The reflexive property of congruence lets you say that ∠pqr ≅
Answers: 1
Mathematics, 21.06.2019 20:00, naimareiad
Ialready asked this but i never got an answer. will give a high rating and perhaps brainliest. choose the linear inequality that describes the graph. the gray area represents the shaded region. y ≤ –4x – 2 y > –4x – 2 y ≥ –4x – 2 y < 4x – 2
Answers: 1
You know the right answer?
60 Points please answer quickly James did an experiment. He started out with 640 bacteria cells. He...
Questions in other subjects:

Mathematics, 09.12.2020 18:20
English, 09.12.2020 18:20
Mathematics, 09.12.2020 18:20


Biology, 09.12.2020 18:20
Mathematics, 09.12.2020 18:20

Computers and Technology, 09.12.2020 18:20
Mathematics, 09.12.2020 18:20


