
Mathematics, 02.03.2021 04:50 224509
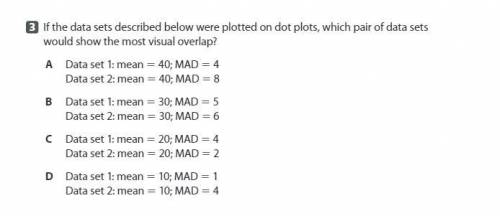
If the data sets described below were plotted on dot plots, which pair of data sets would show the most visual overlap?
A Data set 1: mean 5 40; MAD 5 4
Data set 2: mean 5 40; MAD 5 8
B Data set 1: mean 5 30; MAD 5 5
Data set 2: mean 5 30; MAD 5 6
C Data set 1: mean 5 20; MAD 5 4
Data set 2: mean 5 20; MAD 5 2
D Data set 1: mean 5 10; MAD 5 1
Data set 2: mean 5 10; MAD 5 4

Answers: 2


Other questions on the subject: Mathematics
Mathematics, 21.06.2019 14:30, gabbypittman20
Shania's test scores in 8 subjects were 88, 91, 85, 74, 69, 72, 80, and 87. shania found the middle number of her scores. which type of measure did she find?
Answers: 1
Mathematics, 21.06.2019 17:30, decoreyjpaipxv
Miguel’s teacher asks him to color 4/8 of his grid. he must use 3 colors: red, blue, and green. there must be more green sections than red sections. how can miguel color all the sections of his grid to follow all the rules
Answers: 1
Mathematics, 22.06.2019 05:30, germaine88
Taylor estimated the music department would raise $1,100 for new uniforms by selling tickets to a performance next week each ticket will be $12.75 about how many tickets does the music department need to sell for taylor's estimate to be reasonable
Answers: 3
You know the right answer?
If the data sets described below were plotted on dot plots, which pair of data sets would show the m...
Questions in other subjects:


