
Mathematics, 02.03.2021 04:20 HAMILTRASHANDIKNOWIT
Can someone please check if my answer is correct in the picture?
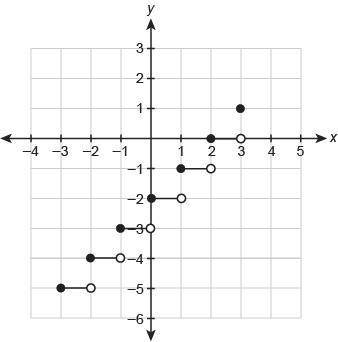
Which graph represents the function over the interval [−3, 3]?
f(x)=⌊x⌋−2

Answers: 1


Other questions on the subject: Mathematics
Mathematics, 21.06.2019 15:30, owlgirl554
Segment xz is bisected by point y. if xy = 12x, and the measure of xz = 18x – 6, solve for x
Answers: 1
Mathematics, 21.06.2019 16:30, trillralyn4060
Rectangle pqrs has length a and width 4b. the x-axis bisects ps and qr what are the coordinates of the vertices
Answers: 2
Mathematics, 21.06.2019 17:30, scoutbuffy2512
How do you use the elimination method for this question? explain, because i really want to understand!
Answers: 1
Mathematics, 21.06.2019 21:30, lraesingleton
Acompany charges $0.10 for each letter engraved. bobby plans to spend no more than $5.00 on the engraving on a jewelry box. write and solve an inequality to find the maximum number of letters he can have engraved.
Answers: 1
You know the right answer?
Can someone please check if my answer is correct in the picture?
Which graph represents the functio...
Questions in other subjects:
Mathematics, 28.01.2020 08:31

Biology, 28.01.2020 08:31
Biology, 28.01.2020 08:31
Mathematics, 28.01.2020 08:31

Mathematics, 28.01.2020 08:31
Mathematics, 28.01.2020 08:31

History, 28.01.2020 08:31
English, 28.01.2020 08:31


