
Mathematics, 02.03.2021 02:00 lorenaandreahjimenez
Frequency Histograms, Bar Graphs and Tables
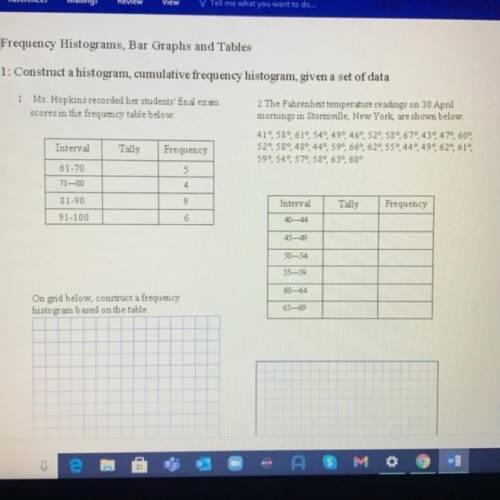
1: Construct a histogram, cumulative frequency histogram, given a set of data
1 Ms. Hopkins recorded her students' final exam
scores in the frequency table below.
2 The Fahrenheit temperature readings on 30 April
momings in Stormville, New York, are shown below.
419 589, 610, 540, 490, 460, 520,589 679 439 470, 60°
520, 580 480, 440, 590, 660, 620, 550, 440, 490, 620, 619
590, 540, 57, 589, 63°, 60°
Interval
Tally
Frequency
5
61-70
71–80
4
81-90
Interval
Tally
Frequency
9
6
91-100
40-44
45-49
50-54
55-59
60-64
On grid below, construct a frequency
histogram based on the table.
65-69

Answers: 3


Other questions on the subject: Mathematics
Mathematics, 21.06.2019 15:00, thegent1859
This is the number of parts out of 100, the numerator of a fraction where the denominator is 100. submit
Answers: 3
Mathematics, 21.06.2019 20:30, Mgarcia325
Justin has 750 more than eva and eva has 12 less than justin together they have a total of 63 how much money did
Answers: 1
You know the right answer?
Frequency Histograms, Bar Graphs and Tables
1: Construct a histogram, cumulative frequency histogra...
Questions in other subjects:


Medicine, 28.08.2019 20:20

Social Studies, 28.08.2019 20:20

Biology, 28.08.2019 20:20


