
Mathematics, 02.03.2021 01:00 juliashalnev
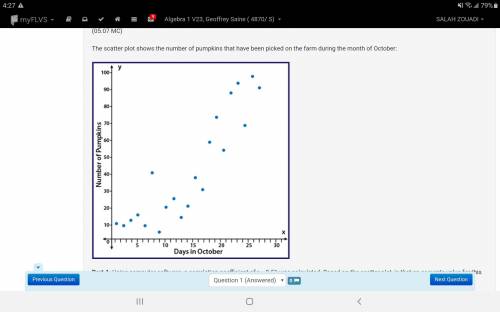
The scatter plot shows the number of pumpkins that have been picked on the farm during the month of October:
A scatter plot with points showing an upward trend with points that are moderately spread out from a line of best fit. The y axis is labeled Number of Pumpkins and the x axis is labeled Days in October
Part A: Using computer software, a correlation coefficient of r = 0.51 was calculated. Based on the scatter plot, is that an accurate value for this data? Why or why not? (5 points)
Part B: Instead of comparing the number of pumpkins picked and the day in October, write a scenario that would be a causal relationship for pumpkins picked on the farm. (5 points)

Answers: 3


Other questions on the subject: Mathematics
Mathematics, 21.06.2019 17:00, michibabiee
Sole with work in 10 years, the average number of hours of tv watched per week by teenagers dropped from 23.9 to 21.4. find the percent of change.
Answers: 1
Mathematics, 21.06.2019 20:00, CelesteN64
For problems 29 - 31 the graph of a quadratic function y=ax^2 + bx + c is shown. tell whether the discriminant of ax^2 + bx + c = 0 is positive, negative, or zero.
Answers: 1
Mathematics, 21.06.2019 21:30, Harriche
The perimeter of a rectangular lot of land is 436 ft. this includes an easement of x feet of uniform width inside the lot on which no building can be done. if the buildable area is 122 ft by 60 ft, determine the width of the easement. select one: a. 9 feet b. 18 feet c. 4.5 feet d. 7 feet
Answers: 3
You know the right answer?
The scatter plot shows the number of pumpkins that have been picked on the farm during the month of...
Questions in other subjects:


History, 03.12.2020 01:00
Mathematics, 03.12.2020 01:00


Mathematics, 03.12.2020 01:00


