Mathematics, 02.03.2021 01:00 arnold2619
I BEG FOR HELP
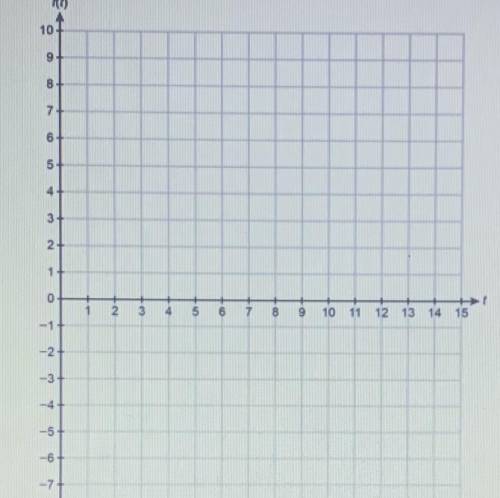
As scientist recorded the movement of a pendulum for 10 s. The scientist began recording when the pendulum was at its resting position. The pendulum then moved right (positive displacement) and left (negative displacement) several times. The pendulum took 4 a to swing to the right and the left and then return to its resting position. The pendulums furthest distance to either side was 6 in. Graph the function that represents the pendulums displacement as a function of time.
(A). Write an equation to represent the displacement of the pendulum as a function of time
(B). Graph the function
Please explain the question and steps and show me the graph


Answers: 2


Other questions on the subject: Mathematics

Mathematics, 20.06.2019 18:04, jelani4brown
The time spent dancing (minutes) and the amount of calories burned can be modeled by the equation c= 5.5t which table of values matches the equation and includes only viable solutions
Answers: 3

Mathematics, 21.06.2019 17:30, hailscooper7363
Simplify this expression.2(10) + 2(x – 4) a. 2x + 16 b. x + 12 c. 2x + 12 d. x + 16
Answers: 2

Mathematics, 21.06.2019 18:40, stephen4438
Which of the following represents the range of the graph of f(x) below
Answers: 1

Mathematics, 22.06.2019 01:00, lilblackbird4
X^2/100+y^2/25=1 the y-intercepts are at: a) (-10,0) and (10,0) b) (0,10) and (0,5) c) (0,-5) and (0,5)
Answers: 1
You know the right answer?
I BEG FOR HELP
As scientist recorded the movement of a pendulum for 10 s. The scientist began recor...
Questions in other subjects:

History, 22.11.2020 20:50

English, 22.11.2020 20:50

English, 22.11.2020 20:50


Business, 22.11.2020 20:50

Mathematics, 22.11.2020 20:50

History, 22.11.2020 20:50


Computers and Technology, 22.11.2020 20:50


