The graph below shows the temperature in
Paula's house over time after her mother turned
on t...

Mathematics, 01.03.2021 22:50 apgg303
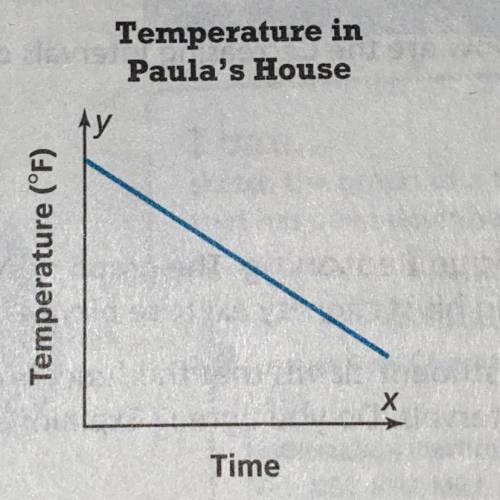
The graph below shows the temperature in
Paula's house over time after her mother turned
on the air conditioner. Describe the relationship
between the two quantities.

Answers: 2


Other questions on the subject: Mathematics
Mathematics, 21.06.2019 23:00, jjackson0010
If mary had 320 toy cars and she gave her friend 50 cars and then she gave her brother 72 more cars how much toy cars would mary have left ● explain with proper details
Answers: 1
You know the right answer?
Questions in other subjects:

Mathematics, 29.09.2020 17:01

Health, 29.09.2020 17:01


Chemistry, 29.09.2020 17:01
Mathematics, 29.09.2020 17:01


