
Mathematics, 01.03.2021 21:50 xbeatdroperzx
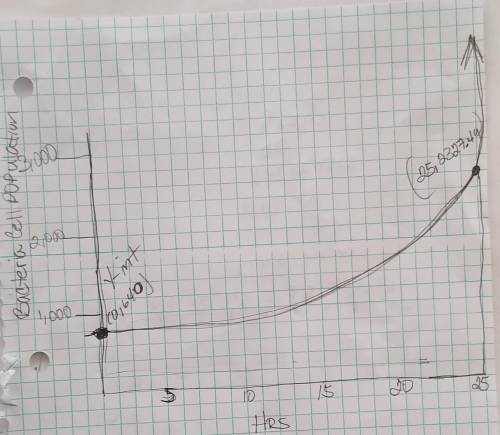
Please help me with the following question! James did an experiment. He started out with 640 bacteria cells. He found that the growth rate of the bacteria cells was 5.3%. Sketch the graph that represents the situation. Label the y-intercept and the point that represents the projected bacteria population 25 h from the time James started the experiment.

Answers: 1


Other questions on the subject: Mathematics
Mathematics, 21.06.2019 14:00, holaadios222lol
Which expression is equivalent to? assume x > 0 and y > 0.
Answers: 1
Mathematics, 21.06.2019 16:30, GalaxyWolf1895
An automated water dispenser fills packets with one liter of water on average, with a standard deviation of 5 milliliter. the manual says that after a year of operation the dispenser should be tested to see if it needs recalibration. a year later a number of filled packets are set aside and measured separately. it is found that the average packet now contains about 0.995 liters. does the dispenser need calibration? explain your answer.
Answers: 2
Mathematics, 21.06.2019 19:00, stephaniem0216
Jack did 3/5 of all problems on his weekend homework before sunday. on sunday he solved 1/3 of what was left and the last 4 problems. how many problems were assigned for the weekend?
Answers: 1
Mathematics, 21.06.2019 20:00, mharrington2934
What are the digits that repeat in the smallest sequence of repeating digits in the decimal equivalent of 24/11?
Answers: 1
You know the right answer?
Please help me with the following question!
James did an experiment. He started out with 640 bacter...
Questions in other subjects:


Mathematics, 22.10.2020 23:01

Social Studies, 22.10.2020 23:01

Biology, 22.10.2020 23:01
Mathematics, 22.10.2020 23:01


