
Mathematics, 01.03.2021 18:00 kortlen4808
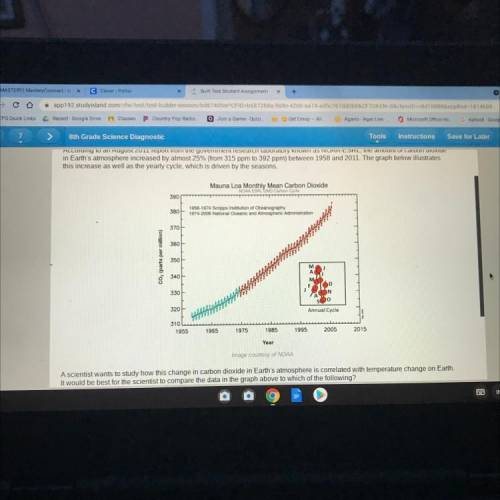
A scientist wants to study how this change in carbon dioxide in Earth's atmosphere is correlated with temperature change on Earth.
It would be best for the scientist to compare the data in the graph above to which of the following?
OA. a table showing the average high and low temperatures in various cities in 1958
ОВ. a graph showing the annual average global temperatures for 1958 through 2011
OC a table showing the average high and low temperatures in various cities in 2011
OD a graph showing the annual low temperatures in one city for 1958 through 2011

Answers: 2


Other questions on the subject: Mathematics
Mathematics, 21.06.2019 17:00, zacksoccer8279
Me! last question, and i'm stuck! write the algebraic expression that models the word phrase. the product of 2 divided by the number h and 8 more than the number k
Answers: 1
Mathematics, 21.06.2019 21:30, jarviantemelton
Consider the following equation. 1/2x^3+x-7=-3sqrtx-1 approximate the solution to the equation using three iterations of successive approximation. use the graph below as a starting point. a. b. c. d.
Answers: 3
Mathematics, 22.06.2019 00:20, cjasmine626
What is the slope of the line passing through the points (3, 3) and (5, 7) ? 1. 2 2. 1/2 3. −2 4. −1/2
Answers: 2
You know the right answer?
A scientist wants to study how this change in carbon dioxide in Earth's atmosphere is correlated wit...
Questions in other subjects:

History, 21.06.2019 18:30

Advanced Placement (AP), 21.06.2019 18:30
History, 21.06.2019 18:30

History, 21.06.2019 18:30


