Use a table with values x = {−2, −1, 0, 1, 2} to graph the quadratic function y = −2x^2.
...

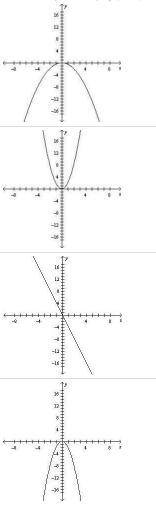
Mathematics, 01.03.2021 17:40 venecia53
Use a table with values x = {−2, −1, 0, 1, 2} to graph the quadratic function y = −2x^2.

Answers: 3


Other questions on the subject: Mathematics
Mathematics, 21.06.2019 15:30, rishiganesh
Michelle had a birthday party. she bought a bag of candy with 96 starbursts, 72 hershey's, and 68 reese's. she wants to use all the candy she bought to make goody bags with the same amount of starbursts, hershey's and reese's in each bag. what is the largest number of bags she can make?
Answers: 1
Mathematics, 21.06.2019 19:00, hiddenauthors436
Ineed to know the answer to this algebra question.
Answers: 1
Mathematics, 21.06.2019 23:30, michaellangley
Consider the input and output values for f(x) = 2x - 3 and g(x) = 2x + 7. what is a reasonable explanation for different rules with different input values producing the same sequence?
Answers: 1
You know the right answer?
Questions in other subjects:

Mathematics, 14.09.2021 04:40
Mathematics, 14.09.2021 04:40


Business, 14.09.2021 04:40


Mathematics, 14.09.2021 04:40


