
Mathematics, 01.03.2021 14:00 goargrant
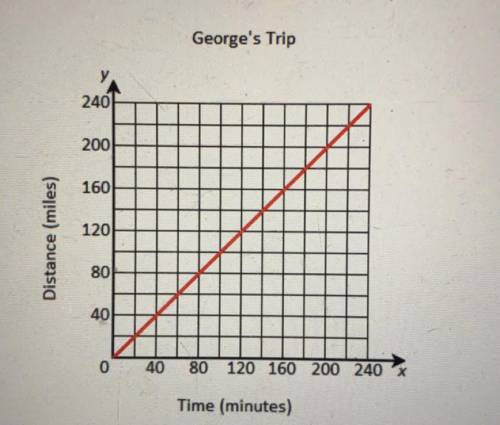
George drove 240 miles to his grandmother's house. The graph below shows the relationship between the distance he traveled and time. What does the slope of the graph represent? A. George's speed in minutes per mile. B. The total distance he has traveled. C. The total distance he has left to travel. D. George's speed in miles per minute.

Answers: 2


Other questions on the subject: Mathematics
Mathematics, 21.06.2019 13:10, mountassarhajar2008
Identify whether the figure has plane symmetry, symmetry about an axis, or neither.
Answers: 1
Mathematics, 21.06.2019 15:00, gghkooo1987
This is the number of parts out of 100, the numerator of a fraction where the denominator is 100. submit
Answers: 3
Mathematics, 21.06.2019 15:20, trinityrae4657
Beth took out a $20,000 loan for college she is borrowing money from two banks. bank a charges an interest rate of 8.5% bank b charges and interest rate of 10.5% after one year alice owes $1860 in interest how much money did she borrow from bank a
Answers: 3
You know the right answer?
George drove 240 miles to his grandmother's house. The graph below shows the relationship between th...
Questions in other subjects:

History, 23.10.2020 18:00
Mathematics, 23.10.2020 18:00


English, 23.10.2020 18:00


