
Mathematics, 28.02.2021 19:30 toxsicity
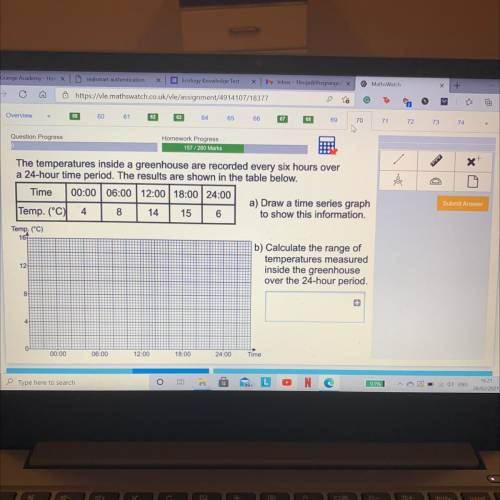
The temperatures inside a greenhouse are recorded every six hours over
a 24-hour time period. The results are shown in the table below.
Time 00:00 06:00 12:00 18:00 24:00
a) Draw a time series graph
Temp. (°C) 4 8 14 15 6
to show this information.
Temp. (°C)
167
b) Calculate the range of
temperatures measured
inside the greenhouse
over the 24-hour period.
121
8
4
0
00:00
06:00
12:00
18:00
24:00
Time

Answers: 2


Other questions on the subject: Mathematics
Mathematics, 21.06.2019 17:10, ivilkas23
The frequency table shows a set of data collected by a doctor for adult patients who were diagnosed with a strain of influenza. patients with influenza age range number of sick patients 25 to 29 30 to 34 35 to 39 40 to 45 which dot plot could represent the same data as the frequency table? patients with flu
Answers: 2
Mathematics, 21.06.2019 23:00, kayvontay4
The coordinate grid shows a pentagon. the pentagon is translated 3 units to the right and 5 units up to create a new pentagon. what is the rule for the location of the new pentagon?
Answers: 3
You know the right answer?
The temperatures inside a greenhouse are recorded every six hours over
a 24-hour time period. The r...
Questions in other subjects:


Mathematics, 20.09.2020 21:01

Biology, 20.09.2020 21:01
Mathematics, 20.09.2020 21:01


